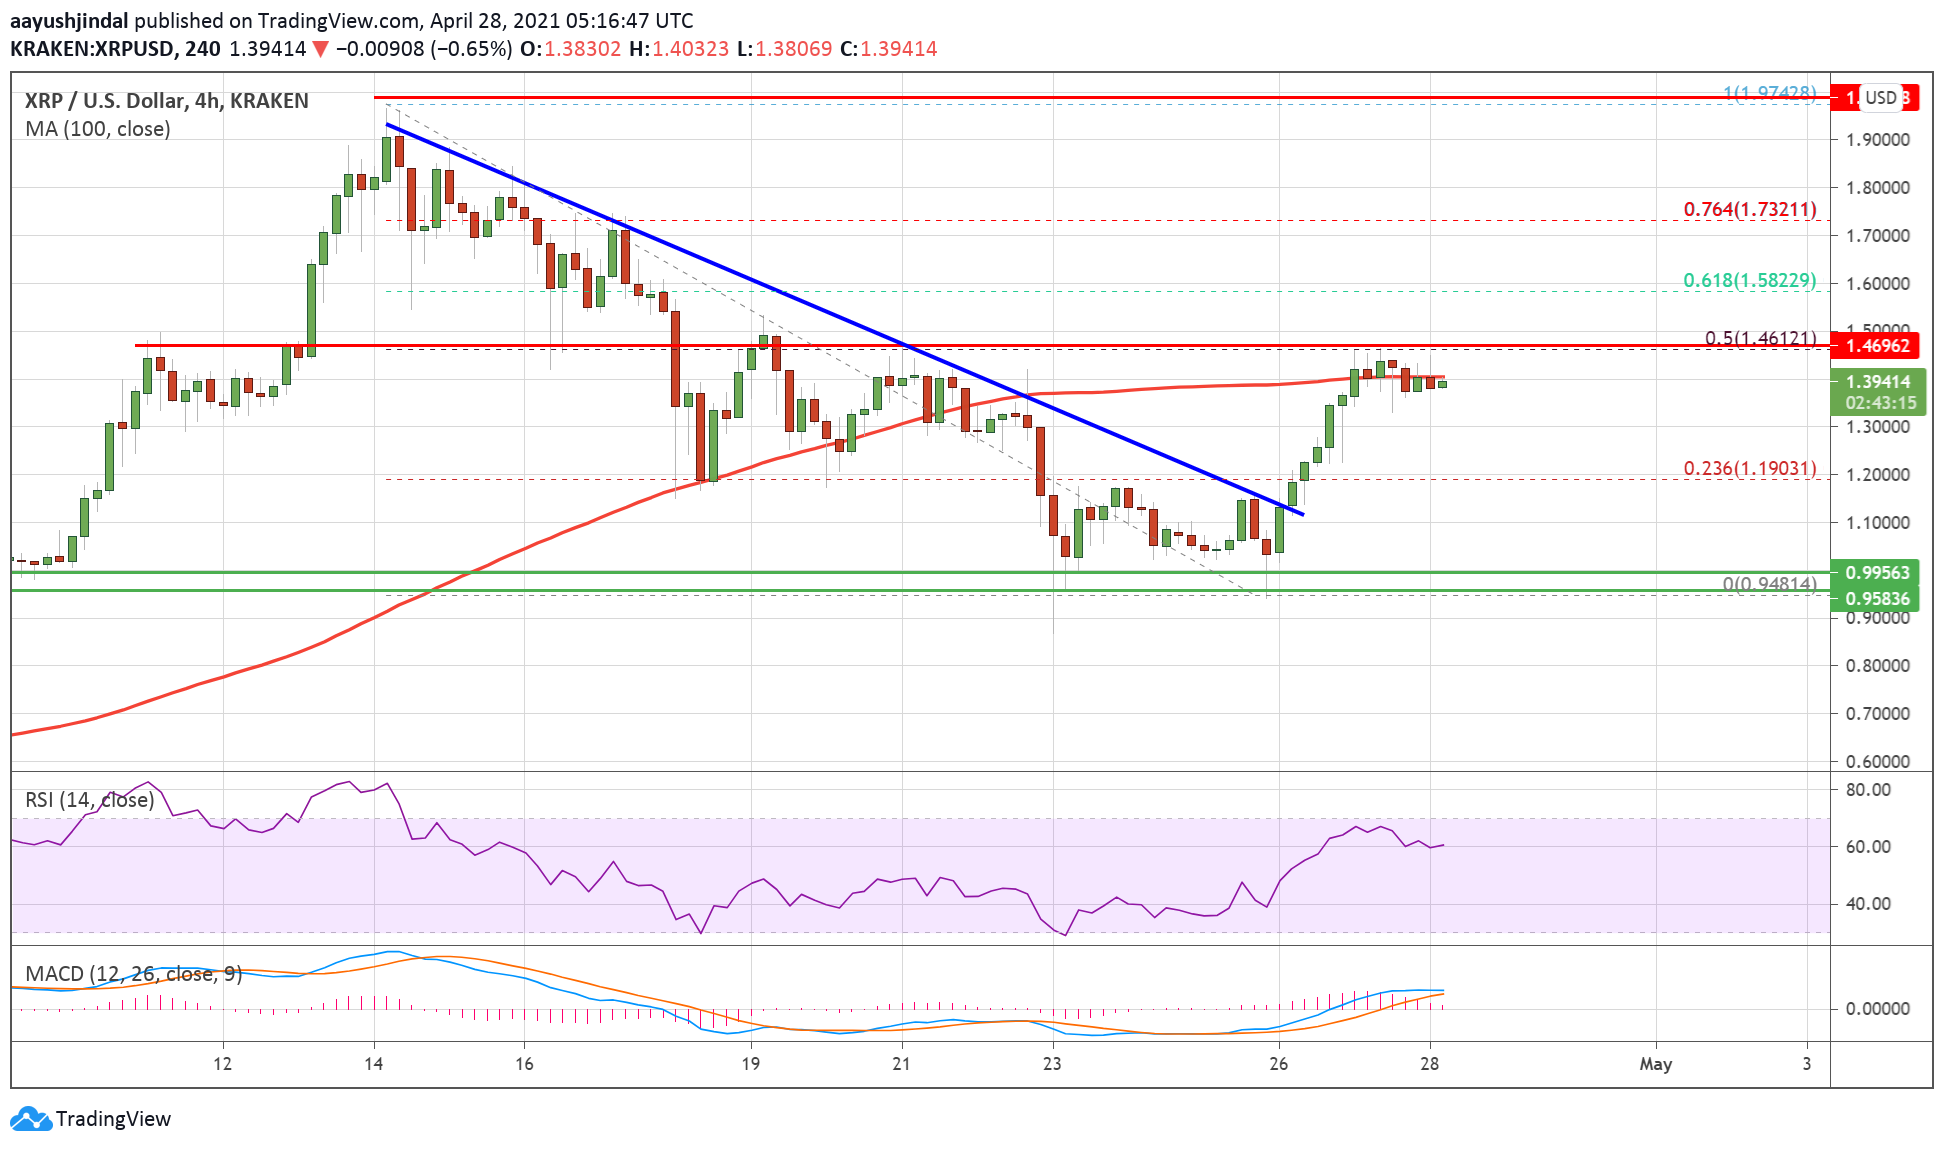
Ripple started a fresh increase after testing $1.00 against the US Dollar. XRP price is likely to surge further if it clears the $1.45 and $1.46 resistance levels.
- Ripple is showing positive signs above the $1.25 and $1.30 resistance levels against the US dollar.
- The price is now trading well above $1.3200 and testing the 100 simple moving average (4-hours).
- There was a break above a major bearish trend line with resistance near $1.15 on the 4-hours chart of the XRP/USD pair (data source from Kraken).
- The pair is likely to start another rally if it clears the $1.45 resistance zone.
Ripple’s XRP Price Eyes More Upsides
This past week, ripple’s XRP found a strong buying interest near the $1.00 zone. XRP formed a support base above $1.00 and started a fresh increase, similar to bitcoin and ethereum.
The price broke many important hurdles near the $1.10 level. There was a break above a major bearish trend line with resistance near $1.15 on the 4-hours chart of the XRP/USD pair. The pair cleared the 23.6% Fib retracement level of the downward move from the $1.97 high to $0.94 swing low.
It is now trading well above $1.3200 and testing the 100 simple moving average (4-hours). XRP is now consolidating near a major hurdle at $1.45.
Source: XRPUSD on TradingView.com
The 50% Fib retracement level of the downward move from the $1.97 high to $0.94 swing low is acting as major barrier. If the bulls succeed in clearing the $1.45 and $1.46 resistance levels, there could be a strong increase. In this case, the price could even rally above the $1.60 and $1.65 levels.
Dips Limited in XRP?
If ripple fails to clear the $1.45 resistance or $1.46, it could correct lower. An initial support on the downside is near the $1.3200 level
The next major support is near the $1.30 level. If there is a downside break and close below the $1.30 level, the price could turn bearish in the short-term. In the stated scenario, the price is likely to drop towards the $1.15 support zone in the coming sessions.
Technical Indicators
4-Hours MACD – The MACD for XRP/USD is slowly gaining pace in the bullish zone.
4-Hours RSI (Relative Strength Index) – The RSI for XRP/USD is now above the 50 level.
Major Support Levels – $1.32, $1.30 and $1.15.
Major Resistance Levels – $1.45, $1.46 and $1.65.
by Aayush Jindal on April 28, 2021 at 11:08AM

Comments
Post a Comment