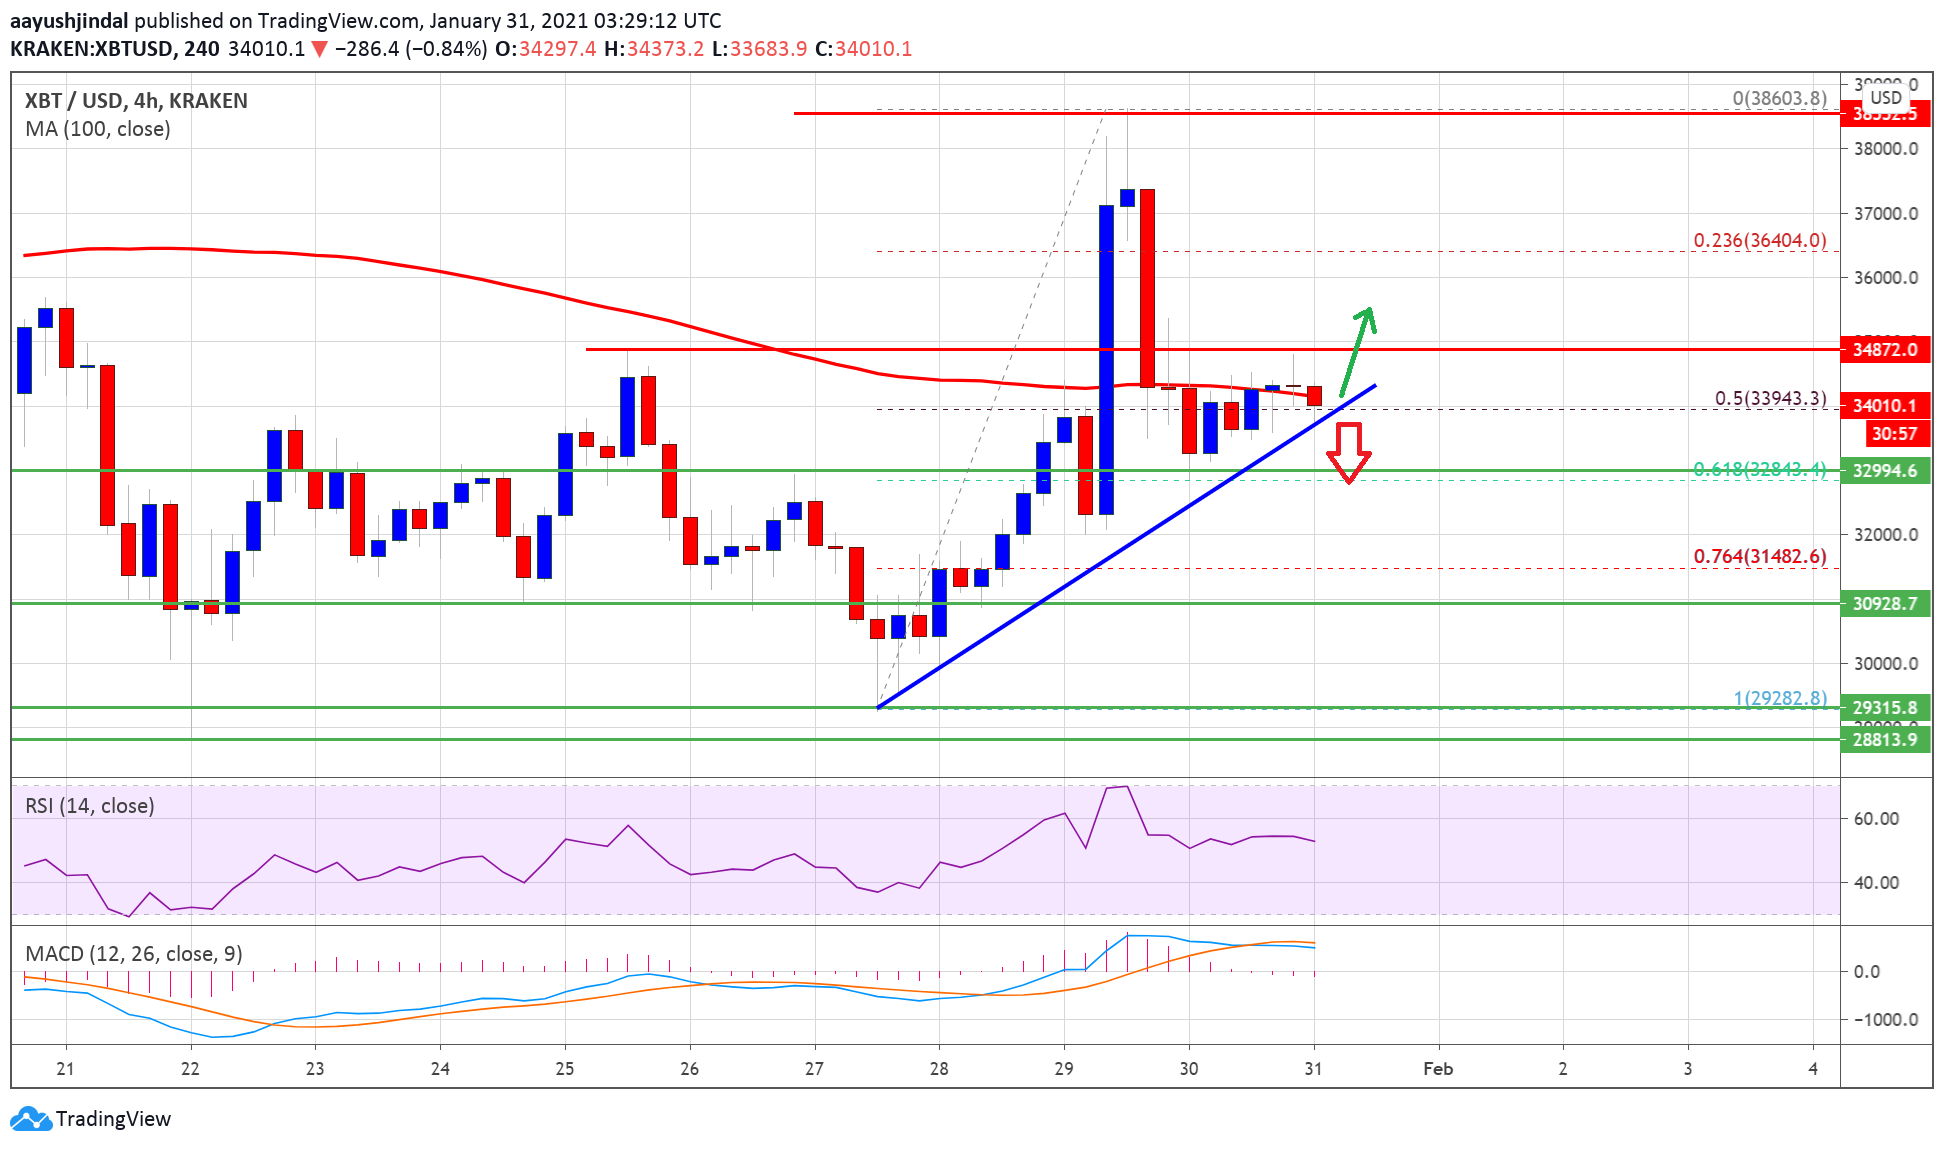
Bitcoin price rallied towards the $38,000 resistance, but it failed to hold gains against the US Dollar. BTC started a fresh decline and it is now struggling to stay above $33,500.
- Bitcoin is showing a few bearish signs below the $35,000 and $35,500 resistance levels.
- The price is now trading near the $34,000 pivot level and the 100 simple moving average (4-hours).
- There is a key bullish trend line forming with support near $33,900 on the 4-hours chart of the BTC/USD pair (data feed from Kraken).
- The pair either decline heavily towards $31,000 or it might clear $35,000 for a fresh increase.
Bitcoin Price Remains At Risk
This past week, bitcoin price saw a sharp upward move above the $35,000 resistance against the US Dollar. The BTC/USD pair surged over 15% and it even climbed above the $36,500 level.
The price spiked above the $38,000 resistance and settled above the 100 simple moving average (4-hours). A high was formed near $38,603 before the price started a fresh decline. There was a sharp decline below the $36,500 and $36,000 levels.
Bitcoin price even traded below the 50% Fib retracement level of the upward move from the $29,282 swing low to $38,603 high. The price even tested the $33,000 support level.
It found support near the 61.8% Fib retracement level of the upward move from the $29,282 swing low to $38,603 high. The price is now trading near the $34,000 pivot level and the 100 simple moving average (4-hours).
There is also a key bullish trend line forming with support near $33,900 on the 4-hours chart of the BTC/USD pair. If there is a clear break below the trend line, the price could continue to move down below $33,500. The next major support is at $33,000. Any more losses could lead the price towards the $31,000 support zone.
Fresh Increase in BTC?
If bitcoin stays above the trend line support, there are chances of a fresh increase above $34,500. An initial resistance on the upside is near the $35,000 level.
A proper break and close above the $35,000 resistance will most likely set the pace for a sustained upward move in the coming sessions. The next major resistance on the upside is near the $36,400 level.
Technical indicators
4 hours MACD – The MACD for BTC/USD is slowly gaining momentum in the bearish zone.
4 hours RSI (Relative Strength Index) – The RSI for BTC/USD is just above the 50 level.
Major Support Level – $33,500
Major Resistance Level – $35,000
by Aayush Jindal on January 31, 2021 at 09:58AM

Comments
Post a Comment