- Bitcoin has surged higher once again as buyers continue to rush in.
- The coin just hit a new year-to-date high of $13,650.
- The cryptocurrency is expected to move higher as Bitcoin has moved above a pivotal technical pattern on a macro scale.
- It also brings the cryptocurrency above the $12,000 resistance.
Bitcoin Undergoes Pivotal Breakout
Bitcoin has surged higher once again as buyers continue to rush in. The leading cryptocurrency has just hit a new year-to-date high at $13,650, a price just under 5% higher than it was 24 hours ago.
The leading cryptocurrency is expected to enter a long-term bull trend as it prints a pivotal breakout. In fact, analysts think that Bitcoin’s ongoing surge higher marks its most important breakout ever.
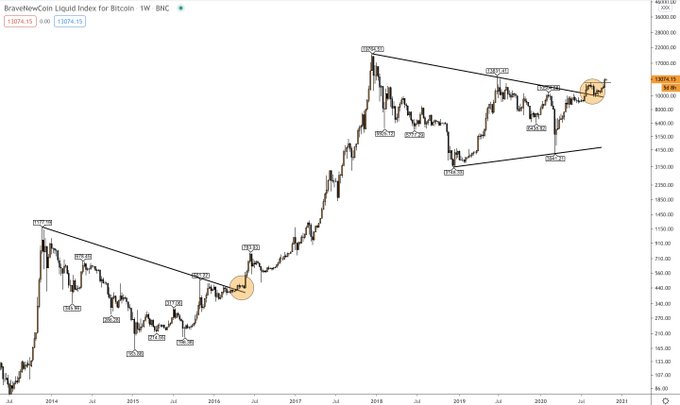
A crypto-asset analyst shared the chart below on October 27th. It shows that Bitcoin’s ongoing rally has brought it above a pivotal technical pattern: a macro flag.
It also brings the cryptocurrency above the $12,000 resistance, which has acted as a point at which multiple rallies have topped on a weekly basis. The coin traded above the $12,000 resistance on a weekly basis, which marked the highest weekly close since January 2018.
As a result of the technical significance of this move, the trader branded this the “most important breakout in BTC history.”
Chart of BTC's price action since the middle of 2013 with analysis by crypto trader CryptoBirb (@Crypto_Birb on Twitter).
Source: BTCUSD from TradingView.com
The trader also noted that the cryptocurrency’s recent price action looks similar to that of late 2015 and early 2016. That was when the cryptocurrency began its last exponential rally.
Not the Only One That Thinks So
This trader isn’t the only one that thinks Bitcoin’s recent price action is pivotal for the technicals of the asset.
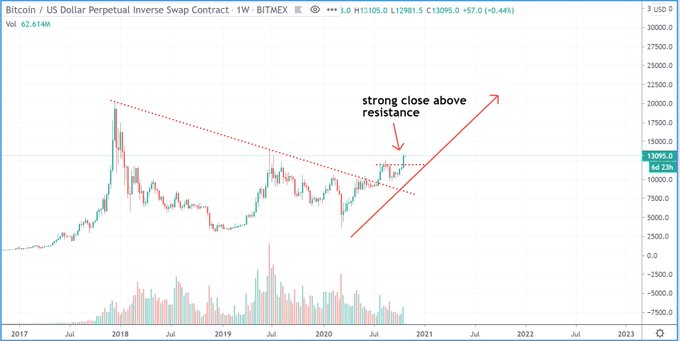
One analyst said that Bitcoin’s weekly close above the “strong resistance” of $12,000 suggests the sky is the limit. As reported by Bitcoinist previously, the analyst wrote on the matter:
“keeping it simple here with $btc, the weekly chart looks phenominal. now firmly above all downtrends from the 2017 20k top and this week just closed on its highs above key 12.5k resistance. the sky is the limit now imo, and this market is not for shorting!”
Chart of BTC's price action since the start of 2017 with analysis by crypto trader SmartContracter (Twitter handle).
Source: BTCUSD from TradingView.com
There are some reasons to be concerned in the near term, though.
Analysts have noted that the cryptocurrency is likely overbought in the near term. For one, the Stochastic RSI, which tracks if an asset is overbought or oversold, is likely trading in an overbought region. Not to mention, some have suggested that there is a strong emphasis on long positions in the CME futures market.
Featured Image from Shutterstock
Price tags: xbtusd, btcusd, btcusdt
Charts from TradingView.com
Bitcoin's Ongoing Surge is Its "Most Important Breakout" Ever: Analyst
by Nick Chong via Bitcoinist.com


Comments
Post a Comment