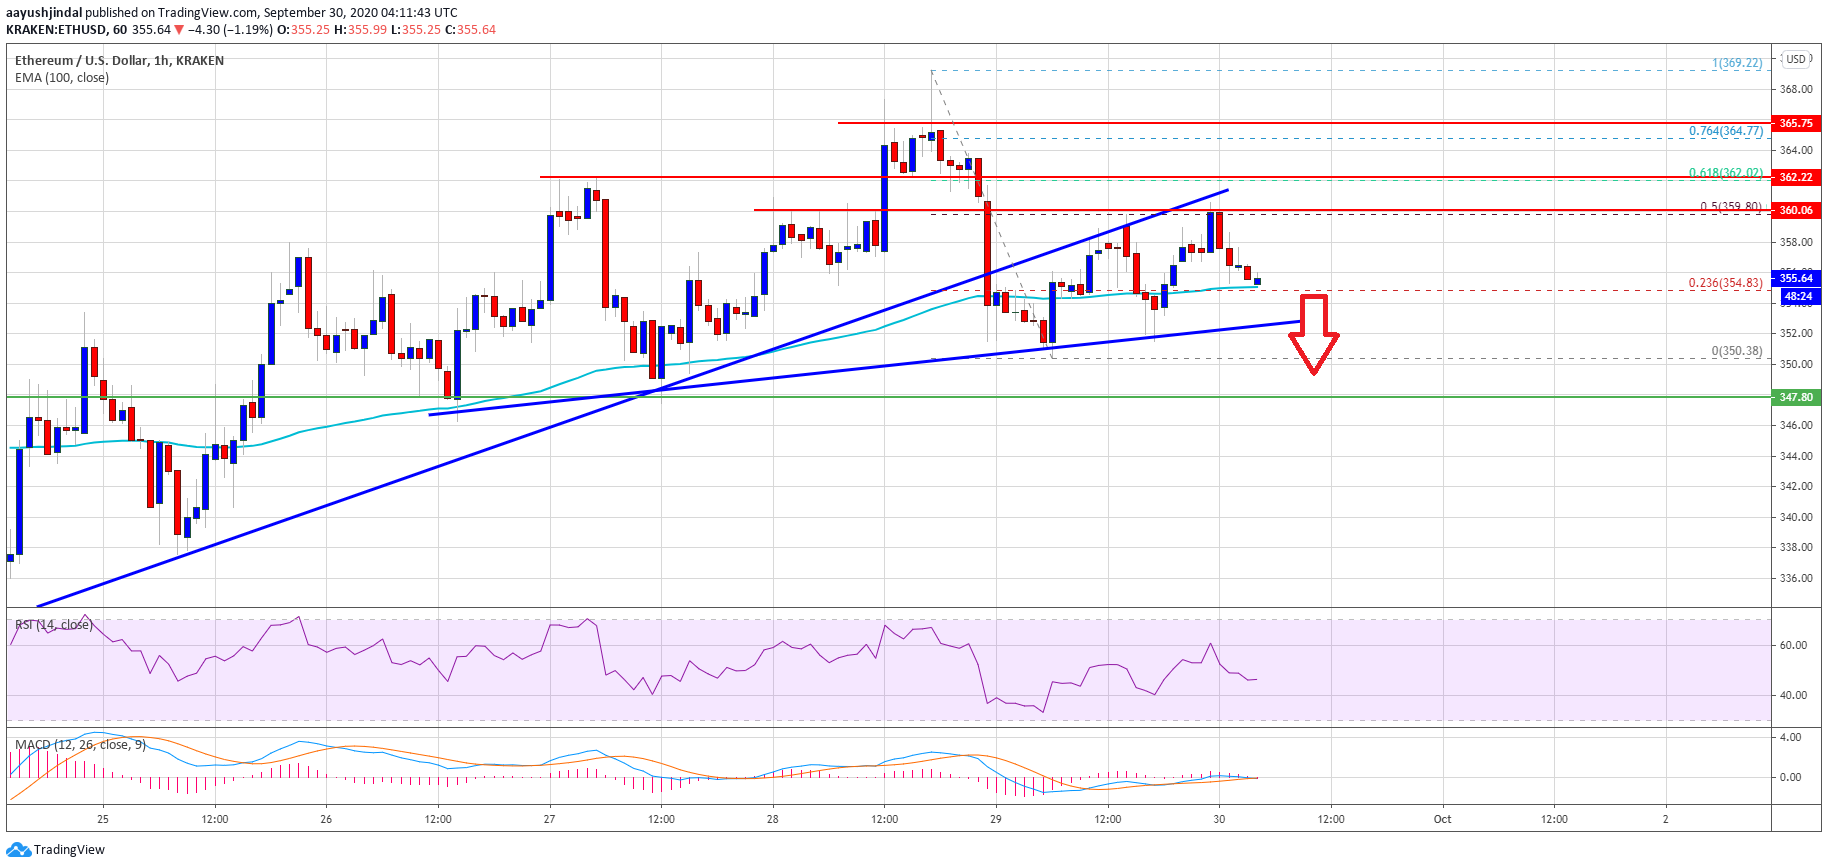
Ethereum is struggling to clear the $360 and $365 resistance levels against the US Dollar. ETH price is showing bearish signs and it could dive below $350 and $345.
- Ethereum is still facing a heavy resistance near the $360 and $365 levels.
- The price is currently stuck near the $355 support and the 100 hourly simple moving average.
- There is a new connecting bullish trend line forming with support near $352 on the hourly chart of ETH/USD (data feed via Kraken).
- The pair is likely to continue lower if it breaks the $352 and $350 support levels.
Ethereum Price is Facing Many Hurdles
Ethereum remained stable above the $350 support level, but it is still facing a heavy resistance near the $360 and $365 levels. ETH started an upward move from the $350 low and climbed above the 100 hourly simple moving average.
There was a break above the 23.6% Fib retracement level of the downward move from the $369 high to $350 low. However, the $360 resistance and the broken bullish trend line seems to be acting as a strong resistance for the bulls.
The 50% Fib retracement level of the downward move from the $369 high to $350 low is also acting as a resistance. Ether price is currently declining and trading near the $355 support level.
Ethereum price trades below $360. Source: TradingView.com
It seems like there is a new connecting bullish trend line forming with support near $352 on the hourly chart of ETH/USD. If ether continues to move down and breaks the trend line support at $352, there is a risk of a bearish break.
The next major support is near the $350 and $348 levels, below which the bears are likely to aim a larger decline towards the $335 support level in the near term.
Chances of Upside Break in ETH?
If Ethereum manages to stay above the $352 and $350 support levels, there are chances of an upside break. An initial resistance is near the $360 level.
The first key resistance could be near the $362 level, above which the bulls might aim a clear break above the $365 resistance level. The next major resistance is near the $375 zone.
Technical Indicators
Hourly MACD – The MACD for ETH/USD is slowly moving back into the bearish zone.
Hourly RSI – The RSI for ETH/USD is currently declining and it is well below the 50 level.
Major Support Level – $350
Major Resistance Level – $360
by Aayush Jindal on September 30, 2020 at 11:18AM

Comments
Post a Comment