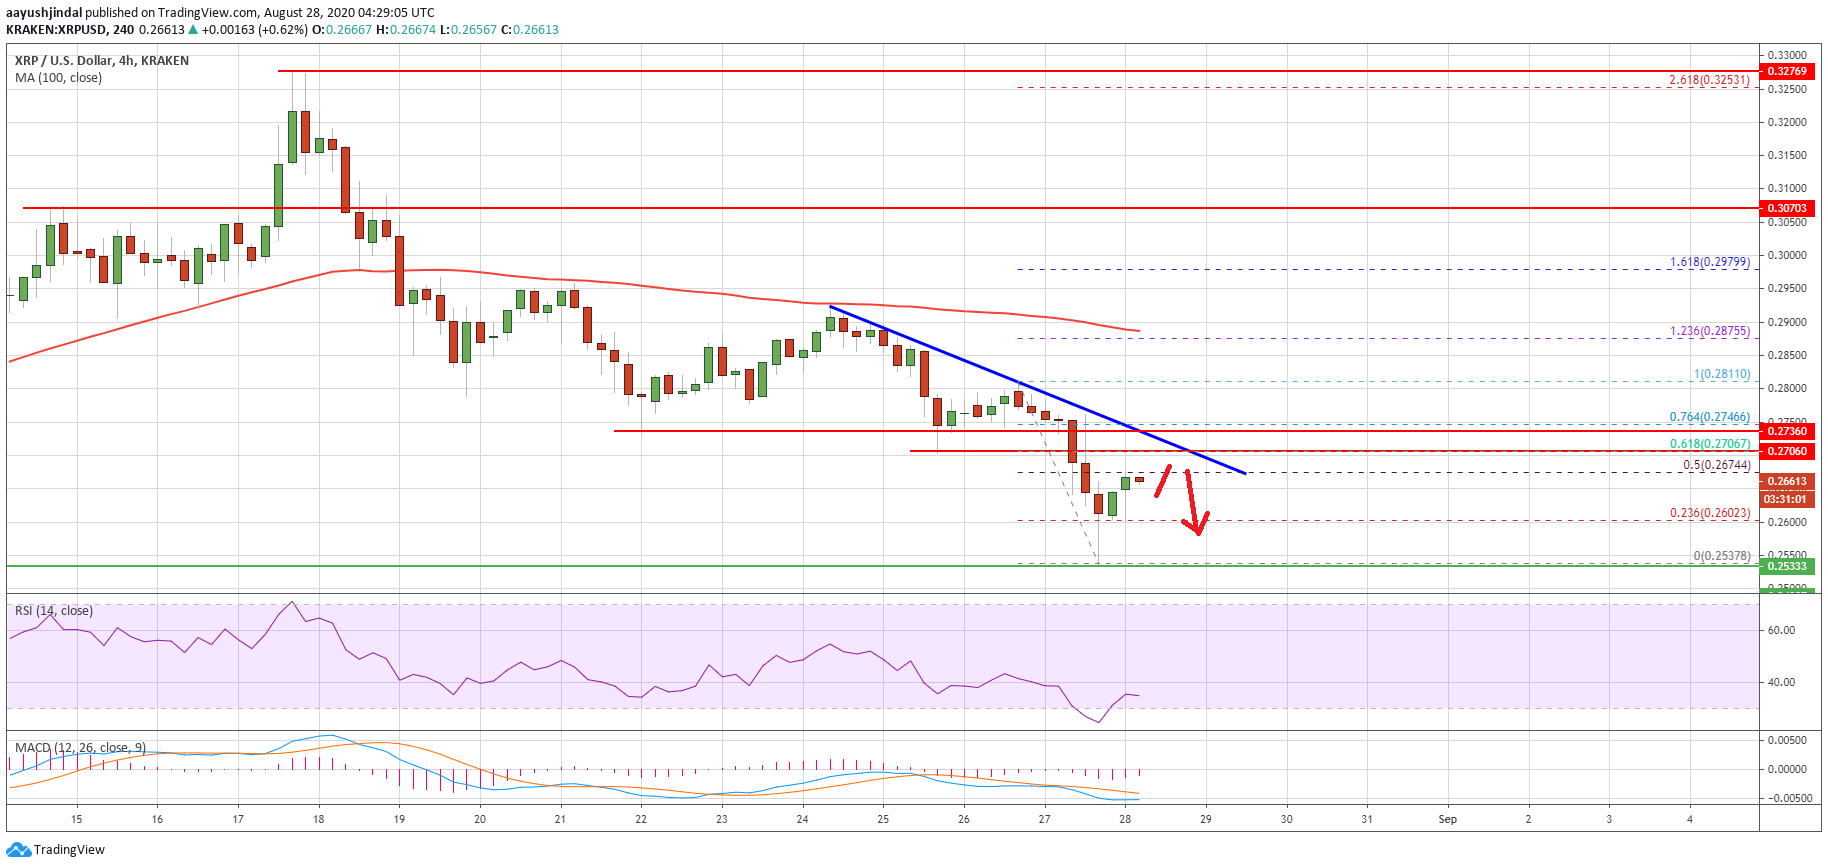
Ripple declined sharply after it broke the $0.2700 support against the US Dollar, while bitcoin and ETH remained above weekly lows. XRP price is currently recovering, but it could fail near $0.2700.
- Ripple is down over 4% and it broke the $0.2720 and $0.2700 support levels against the US dollar.
- The price traded to a new weekly low at $0.2537 and it is currently recovering higher.
- There is a major bearish trend line forming with resistance near $0.2705 on the 4-hours chart of the XRP/USD pair (data source from Kraken).
- The pair is resume its decline as long as it is below $0.2720 and the 100 simple moving average (4-hours).
Ripple Price Turns Red
Yesterday, we discussed the key reasons why ripple could decline sharply below $0.2700. XRP price did fail to break the $0.2840 resistance, resulting in a sharp decline below $0.2720 and $0.2700.
The price fell over 4% and it even broke the $0.2650 support. It traded to a new weekly low at $0.2537 and it is currently recovering higher. There was a break above the $0.2600 resistance level, plus the 23.6% Fib retracement level of the recent decline from the $0.2811 high to $0.2537 low.
The bulls are currently facing resistance near the $0.2675 level. The 50% traded to a new weekly low at $0.2537 and it is currently recovering higher is acting as a resistance.
Ripple (XRP) price trades below $0.2700. Source: TradingView.com
There is also a major bearish trend line forming with resistance near $0.2705 on the 4-hours chart of the XRP/USD pair. It seems like the previous resistance zone near the $0.2700 may now act as a strong selling zone in the coming sessions.
If there is an upside break above the trend line, ripple could recover towards the $0.2800 resistance level. The next key resistance is near the 100 simple moving average (4-hours) at $0.2880.
Fresh Decline in XRP?
If ripple fails to clear the $0.2675 and $0.2700 resistance levels, there is a risk of another bearish reaction. An initial support is near the $0.2620 level.
The main support is near the $0.2540 and $0.2520 levels, below which the price could dive towards $0.2440. More importantly, if XRP stays in a bearish zone below $0.2700, it could drag other altcoins lower in the near term.
Technical Indicators
4-Hours MACD – The MACD for XRP/USD is slowly losing pace in the bearish zone.
4-Hours RSI (Relative Strength Index) – The RSI for XRP/USD is currently well below the 40 level.
Major Support Levels – $0.2620, $0.2600 and $0.2550.
Major Resistance Levels – $0.2675, $0.2700 and $0.2720.
by Aayush Jindal on August 28, 2020 at 11:18AM

Comments
Post a Comment