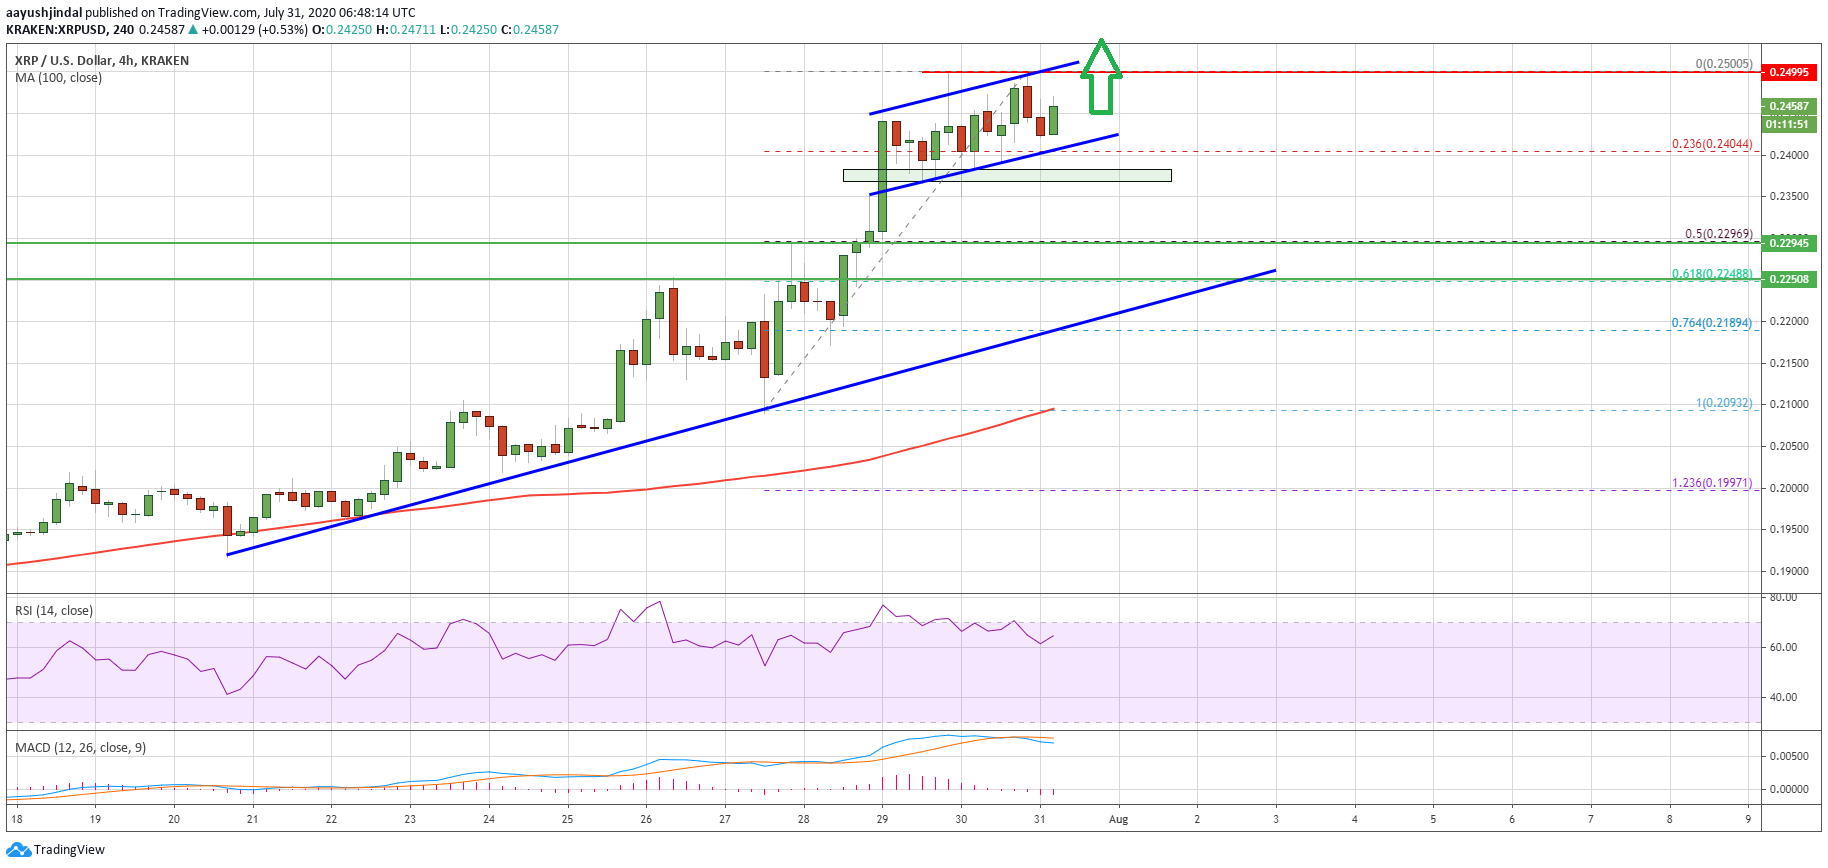
Ripple is up over 2% and it is showing positive signs above the $0.2400 resistance zone against the US Dollar. XRP price is likely to accelerate gains if it clears the $0.2500 resistance.
- Ripple price started consolidating gains after it rallied towards the $0.2500 level against the US dollar.
- The price is currently trading nicely above the $0.2400 and $0.2380 support levels.
- There is a key rising channel forming with support near $0.2410 on the 4-hours chart of the XRP/USD pair (data source from Kraken).
- The pair remains well supported on dips and it could surge above the $0.2500 barrier.
Ripple Price Basing for the Next Move
This week, there was a sharp increase in ripple above $0.2320, following bitcoin and ethereum’s rally. The price even surged above the $0.2400 resistance and settled well above the 100 simple moving average (4-hours).
It traded to a new monthly high at $0.2500 and recently started consolidating gains. There was a minor downside correction below the $0.2450 level, but the bulls remained active near the $0.2400 support zone.
XRP even stayed above the 23.6% Fib retracement level of the upward move from the $0.2093 low to $0.2500 high. There is also a key rising channel forming with support near $0.2410 on the 4-hours chart of the XRP/USD pair.
Ripple (XRP) price trades near $0.2450. Source: TradingView.com
Below the trend line, there is a strong support forming near the $0.2380 level. The next major support is near the $0.2300 level or the 50% Fib retracement level of the upward move from the $0.2093 low to $0.2500 high.
On the upside, the price is facing a major hurdle near the $0.2500 level. If there is a clear break above the $0.250 resistance, the price is likely to accelerate higher towards the $0.2550 and $0.2600 levels in the near term.
Downsides Likely To Be Limited in XRP
Clearly, there are many supports for ripple near the $0.2400 level. The main support is now forming near the $0.2300 level (this week’s breakout zone).
If there is a bearish break below the $0.2300 support, there is a risk of a sharp decline and the price might revisit $0.2200.
Technical Indicators
4-Hours MACD – The MACD for XRP/USD is now gaining strength in the bullish zone.
4-Hours RSI (Relative Strength Index) – The RSI for XRP/USD is still well above the 55 level.
Major Support Levels – $0.2400, $0.2380 and $0.2300.
Major Resistance Levels – $0.2500, $0.2550 and $0.2600.
Take advantage of the trading opportunities with Plus500
Risk disclaimer: 76.4% of retail CFD accounts lose money.
by Aayush Jindal on July 31, 2020 at 01:18PM

Comments
Post a Comment