At the start of June, Bitcoin suddenly surged towards and past $10,000. The cryptocurrency rallied so far and so fast that $123 million worth of short positions on BitMEX were liquidated within an hour.
Investors were understandably bullish. One Wall Street veteran shared a chart expressing his sentiment. It showed that BTC had broken past a technical downtrend that formed after the $20,000 all-time high. Others shared in the sentiment, saying that the move was the start of a big bull run.
Yet as fast as the cryptocurrency rallied, it crashed, rapidly falling under $10,000 just a day later.
Despite the rejection, analysts remain bullish. One trader has said that from a macro perspective, Bitcoin is still in a strengthening uptrend.
Related Reading: An Infamous Bitcoin Whale Just Resurfaced — and He’s Got a Bone to Pick
Bitcoin In a Strengthening Uptrend? Analyst Weighs In
It’s been easy to flip bearish after Bitcoin’s rejection at $10,500 earlier this month.
That price level has marked a number of crucial highs over the past year for the leading cryptocurrency.
The “Xi Pump” in October of 2019 topped at nearly that exact level, leading to a multi-month correction to $6,400. Also, the early-2020 rally that ended in February also abruptly ended at $10,500.
Yet Eric “Parabolic” Thies is arguing that Bitcoin remains in a macro uptrend.
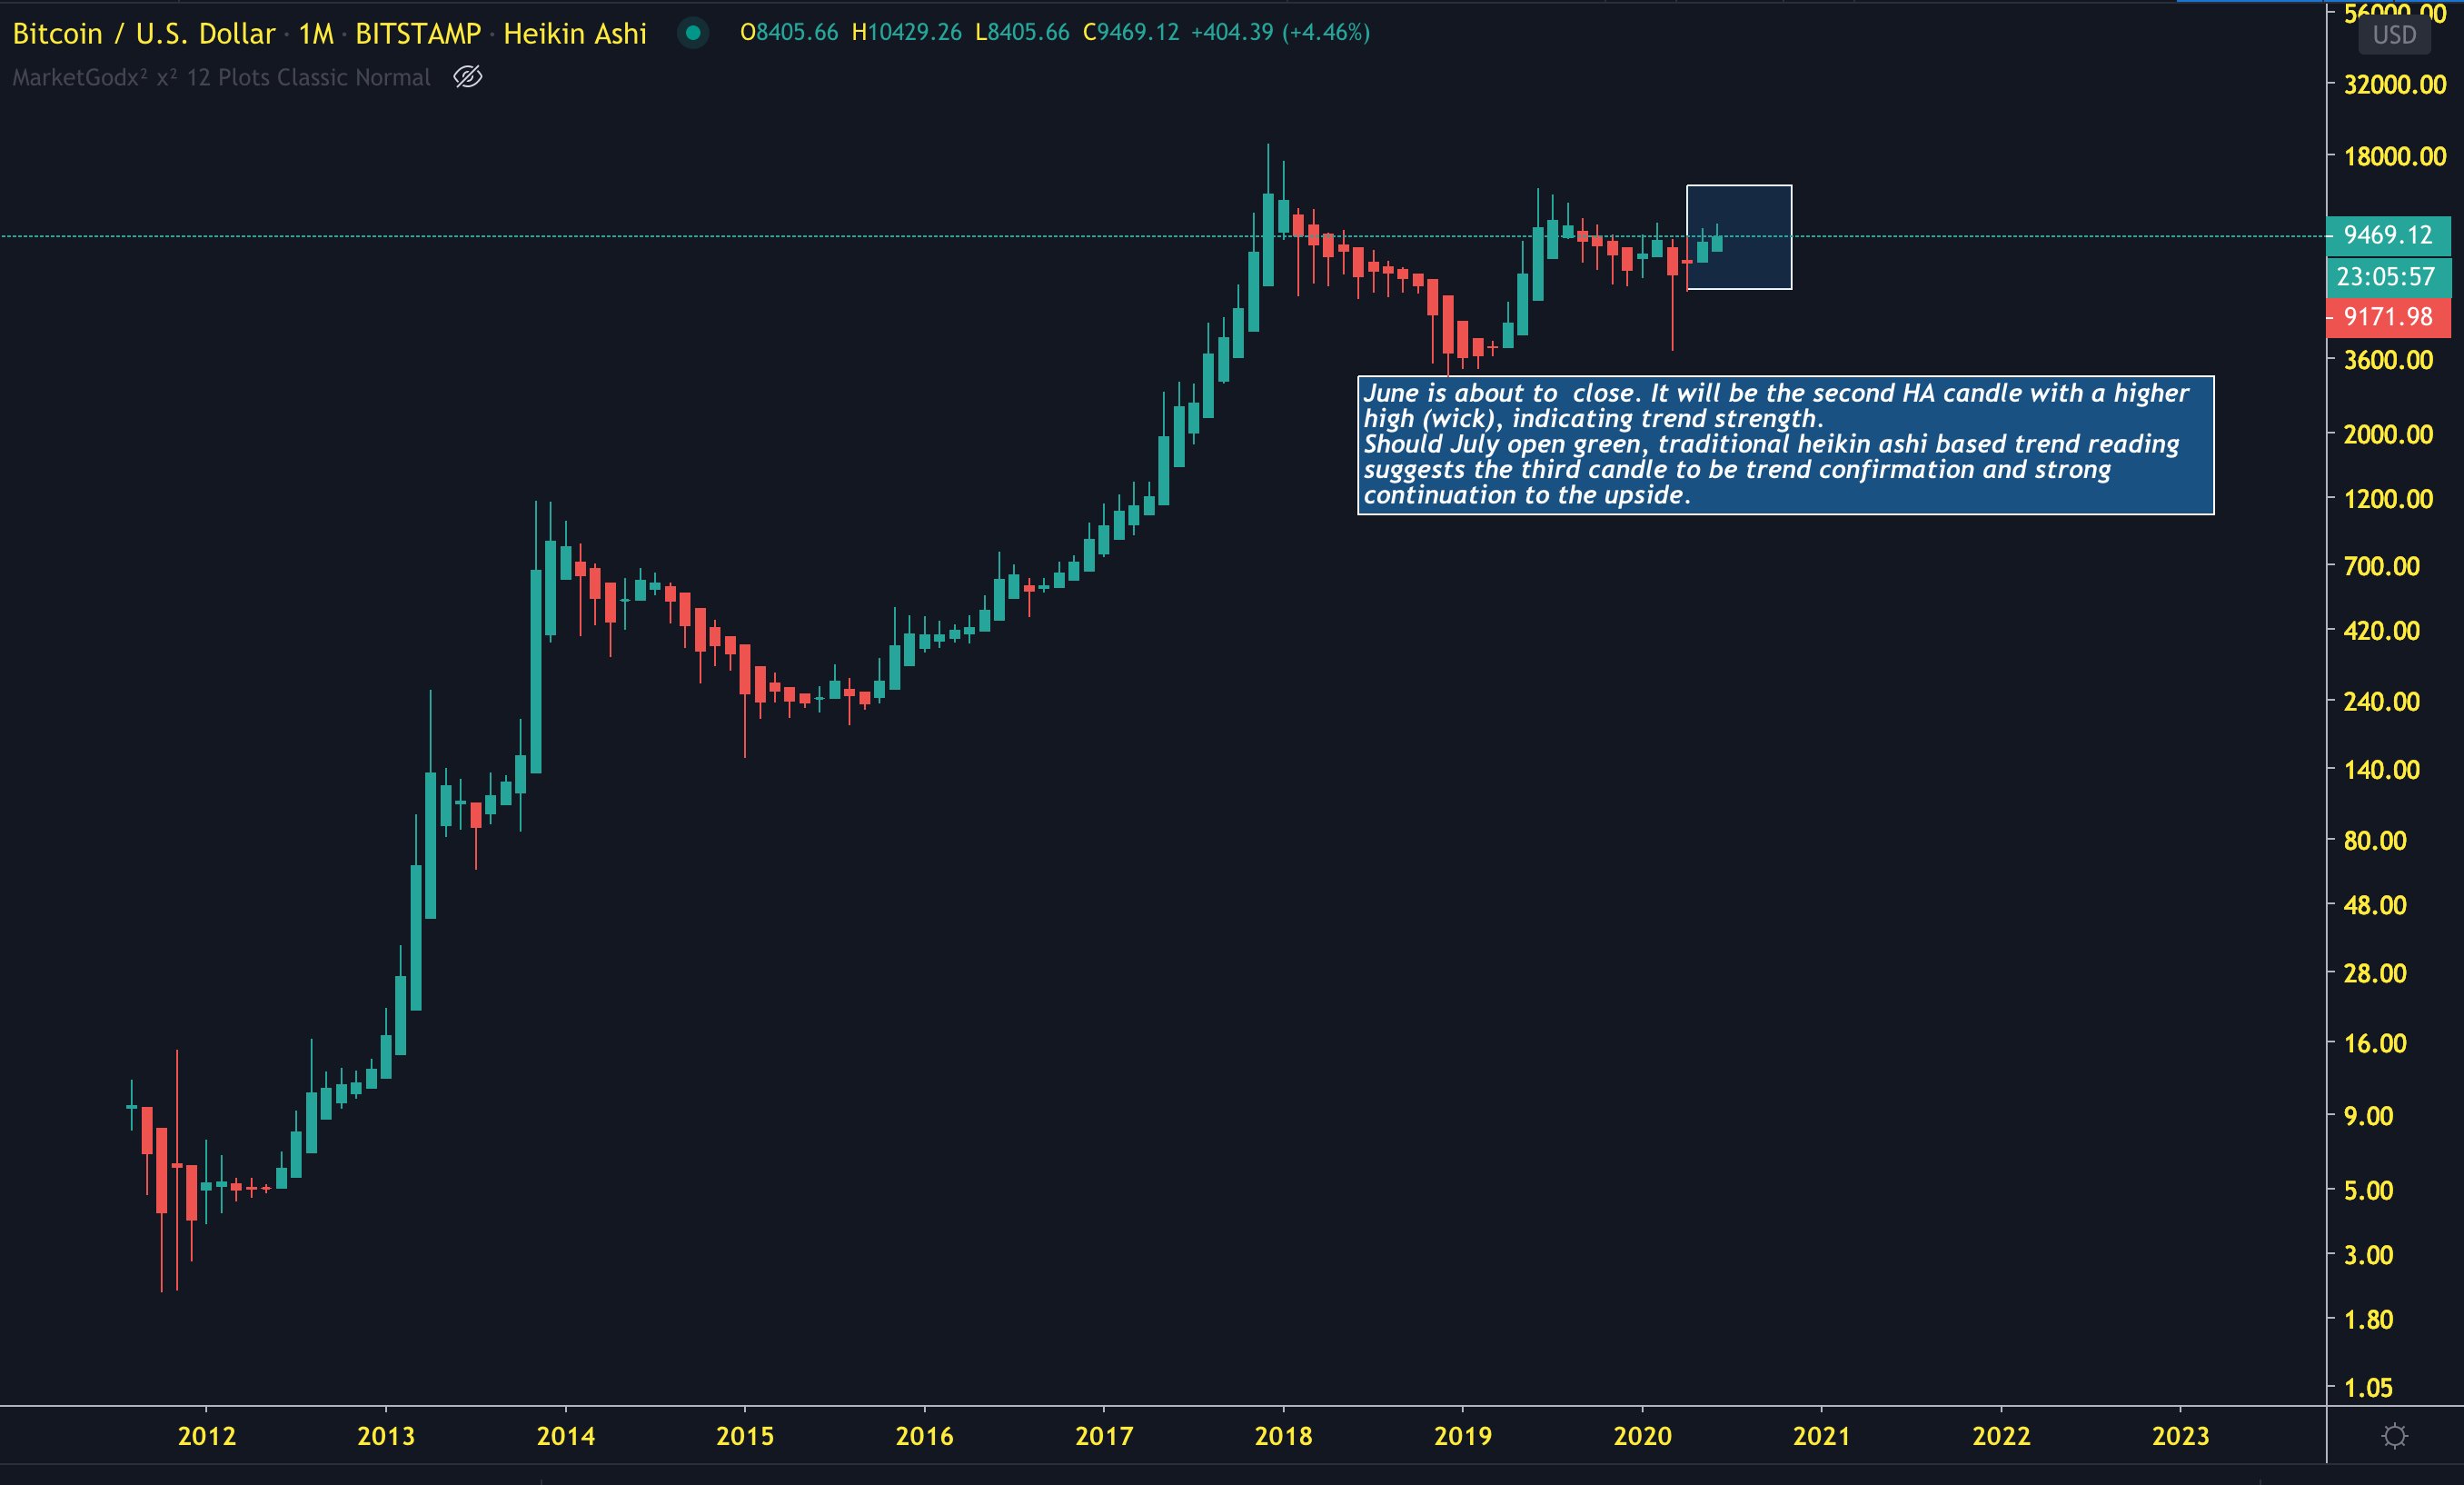
He shared the chart below on June 29th. It shows BTC’s one-month price action with so-called Heikin-Ashi candles, which are normally used to observe trends.
Per Thies, with June about to close with a wick higher than May’s, Bitcoin is signaling “trend strength.”
He added that should “July open green, traditional Heikin Ashi-based trend reading suggests the third candle to be trend confirmation and strong continuation to the upside.”
BTC price chart shared by Eric “Parabolic” Thies, a crypto analyst. Chart from TradingView.com
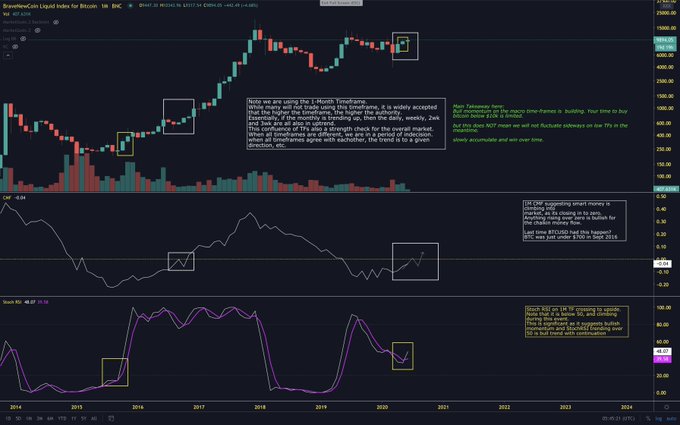
Thies’ latest analysis comes shortly after he noted that two long-term bullish technical signals are imminent.
He noted that the one-month Chaikin Money Flow and Stochastic RSI indicators suggest that “your time to buy Bitcoin below $10k is limited.” The indicators last looked as they did now prior to the 2016-2017 bull run that took BTC from the hundreds to $20,000.
Bitcoin price chart shared by Eric “Parabolic” Thies, a crypto analyst. Chart from TradingView.com
Fending Off the PlusToken & Miner Threat
Bitcoin will have to fend off two big pools of selling pressure, though, if it is to head higher.
Those are the ~$450 million recently moved by the PlusToken scam operators and Bitcoin miners.
DTC Capital’s Spencer Noon reported that the operators of the scam are moving coins, with some moving to mixers and exchanges to presumably be sold:
“This week the following #PlusToken funds have been on the move to exchanges and new addresses for mixing: – 22k BTC ($203m USD) – 789k ETH ($183m) – 26m EOS ($68m) – 20m XRP ($4m). The big question: can the crypto markets absorb this volume or are we headed lower?”
Blockchain analytics firm Glassnode has also reported that miners are withdrawing more coins to exchanges than they have in a year.
Featured Image from Shutterstock
Price tags: xbtusd, btcusd, btcusdt
Charts from TradingView.com
Despite Brutal Rejection at $10.5k, Bitcoin Uptrend Has "Strength": Analyst
by Nick Chong on June 30, 2020 at 03:30PM


Comments
Post a Comment