- Ethereum is still facing resistance near the $155 and $156 levels levels against the US Dollar.
- The price is likely to make a sustained move higher once it breaks the $156 resistance.
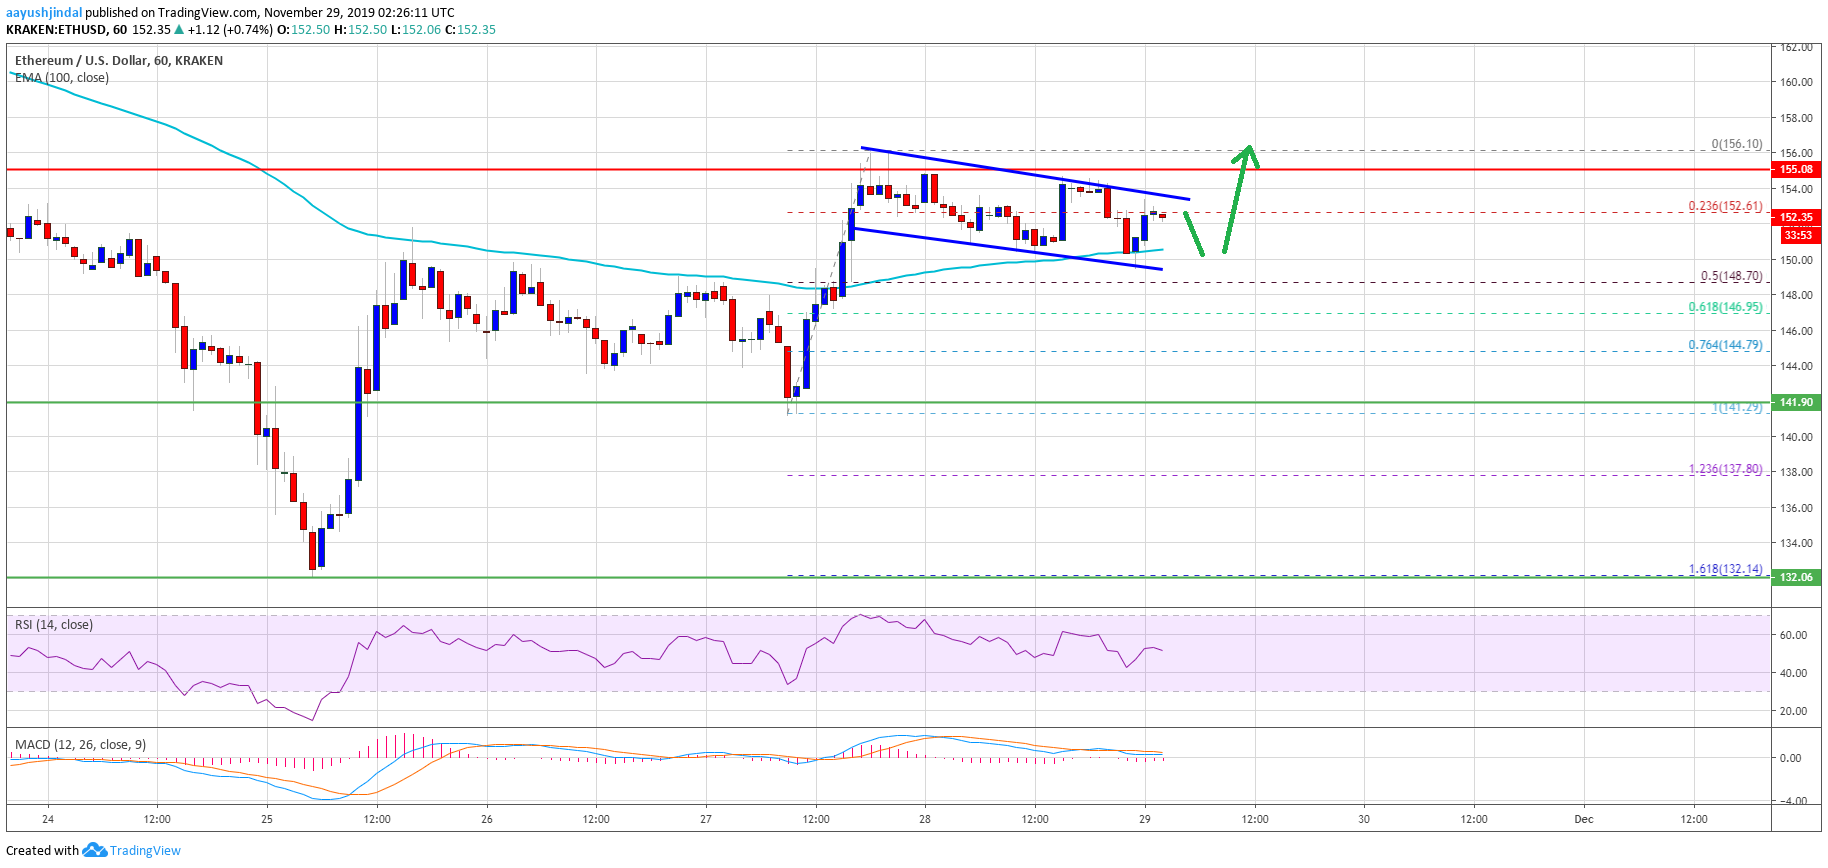
- There is a key declining channel forming or a bullish flag with resistance near $154 on the hourly chart of ETH/USD (data feed via Kraken).
- The price could start a fresh decline only if it settles below the $142 support area.
Ethereum price is consolidating gains above key supports versus the US Dollar, similar to bitcoin. ETH price could rally towards $165 once it clears the $156 resistance.
Ethereum Price Analysis
Yesterday, there was an upside extension of the recovery initiated from $132 in Ethereum against the US Dollar. ETH price climbed above the key $150 resistance and the 100 hourly simple moving average.
Moreover, the price broke the $152 resistance and tested the next key resistance area near the $155 level. A high was formed near the $156 level and the price is currently consolidating gains.
It corrected below the $152 level. Besides, there was a push below the 23.6% Fib retracement level of the recovery wave from the $142 low to $156 high. At the moment, the price seems to be holding the $150 support and the 100 hourly simple moving average.
On the upside, there is a strong resistance forming for Ethereum near the $155 and $156 levels. Additionally, there is a key declining channel forming or a bullish flag with resistance near $154 on the hourly chart of ETH/USD.
Therefore, an upside break above the $155 and $156 resistance levels could push the price further higher. It is likely to make a sustained move higher towards the $165 resistance.
Conversely, the price could continue to correct gains below $150. An initial support is near the $148 level. It represents the 50% Fib retracement level of the recovery wave from the $142 low to $156 high.
The main support on the downside is near the $142 level. If the price closes below the $142 support, it is likely to move back into a bearish zone towards the $132 level.
Looking at the chart, Ethereum price is still trading above many key supports such as $150, $148 and $142. As long as there is no close below $142, there are high chances of a nice upward move above the $155 and $156 resistances in the near term.
ETH Technical Indicators
Hourly MACD – The MACD for ETH/USD is slowly gaining pace in the bearish zone.
Hourly RSI – The RSI for ETH/USD is currently near the 50 level and it could bounce back.
Major Support Level – $148
Major Resistance Level – $155
The post Ethereum (ETH) Could Make Sustained Move Higher appeared first on NewsBTC.
by Aayush Jindal on November 29, 2019 at 08:38AM

Comments
Post a Comment