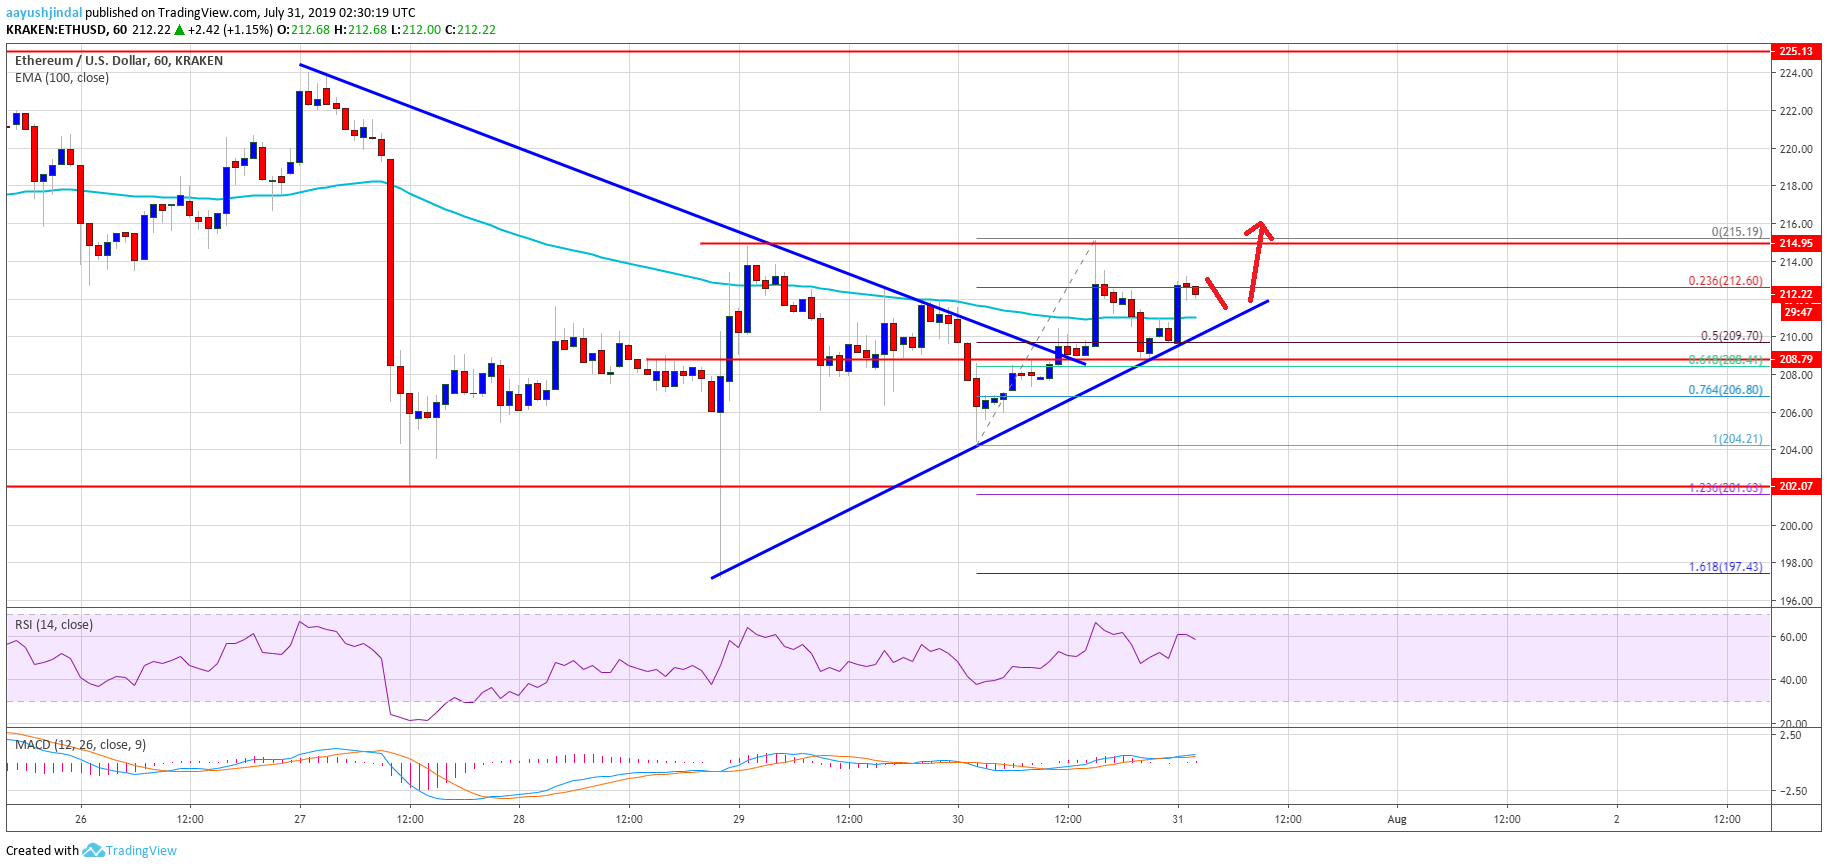
- ETH price remained well bid above the $205 support and recently climbed higher against the US Dollar.
- The price tested the $215 resistance and it is currently correcting gains.
- There was a break above a major bearish trend line with resistance near $208 on the hourly chart of ETH/USD (data feed via Kraken).
- The pair is likely to continue higher above the $215 and $220 resistance levels in the near term.
Ethereum price is showing positive signs above $205 versus the US Dollar, and bitcoin recovered above $9,700. ETH price could accelerate higher once it breaks the $215 resistance.
Ethereum Price Analysis
After forming a decent support above $205, Ethereum price recovered a few points against the US Dollar. The ETH/USD pair formed a swing low near $204 and jumped above the $208 and $210 resistance levels. Later, there was a close above the $210 resistance level and the 100 hourly simple moving average. Similarly, there were positive moves in bitcoin price above the $9,500 and $9,600 levels.
During the rise, there was a break above a major bearish trend line with resistance near $208 on the hourly chart of ETH/USD. The pair tested the $215 resistance and recently corrected lower. It broke the $212 level plus the 23.6% Fib retracement level of the recent upward move from the $204 low to $215 high. However, the bulls were able to protect the $208 support area.
Moreover, the 50% Fib retracement level of the recent upward move from the $204 low to $215 high also acted as a support. More importantly, there is a connecting bullish trend line forming with support near $210 on the same chart. At the moment, the price is trading with a positive bias above the $210 level. On the upside, the main resistance is near the $215 level, above which it could start a solid increase.
The next important resistance is near the $220 level, above which the price could revisit the $225 resistance. On the downside, if there is a break below the trend line, the $208 level might act as a support. If there are more losses, the price could retest the $202 support level.
Looking at the chart, Ethereum price could continue to recover if there is a proper close above the $215 resistance. Conversely, if the price fails to continue higher, there could be a downside reaction below $210 and $208 support levels in the near term.
ETH Technical Indicators
Hourly MACD – The MACD for ETH/USD is losing pace in the bullish zone.
Hourly RSI – The RSI for ETH/USD is currently correcting lower after testing the 60 level.
Major Support Level – $205
Major Resistance Level – $215
The post Ethereum Price (ETH) Signaling Fresh Increase Above $215 & $220 appeared first on NewsBTC.
by Aayush Jindal on July 31, 2019 at 08:38AM

Comments
Post a Comment