
Digital asset markets have been on a tear lately, gaining $68 billion in five days. Currently, there’s over $100 billion in global trade volumes and crypto bulls don’t seem to be letting up any time soon.
Also Read: How to Find a Bitcoin Cash Meetup Near You
The Cryptoconomy Captures $368 Billion
Cryptocurrency markets have seen incredible gains over the last few weeks and between a few small corrections, prices continue to rise. The price of bitcoin core (BTC) has reached a 17-month high and has gathered a market valuation of around $228 billion. BTC has about $32.9 billion worth of global trade volume and at $12,828 per coin, the cryptocurrency is up 40% for the week.
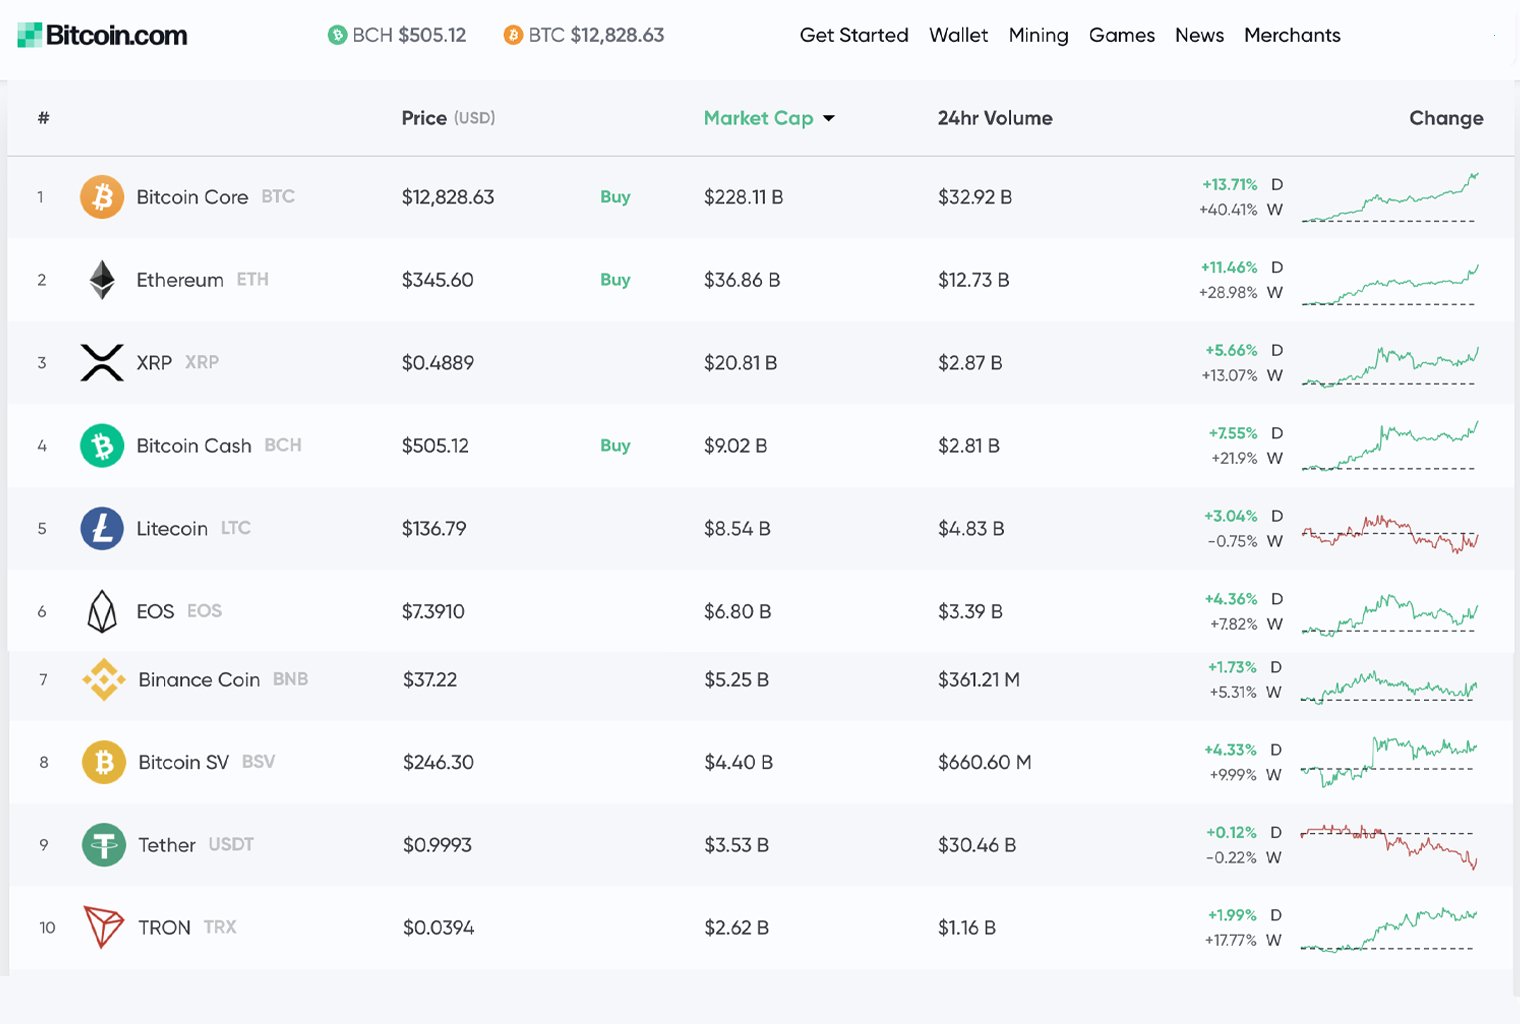
Many other coins have been seeing significant gains as well and ethereum (ETH) prices have jumped 28% in the last 7 days. One ETH is trading for $345 per coin and the currency’s market valuation is around $36 billion on Wednesday, June 26. Following behind ETH is ripple, which has seen very small gains compared to many other coins. XRP is swapping for $0.48 per coin and the market is up 13% for the week. The fifth largest market valuation belongs to litecoin (LTC) and each coin is trading for $136 per unit and markets are actually down 0.75% over the last 7 days.
Bitcoin Cash (BCH) Market Action
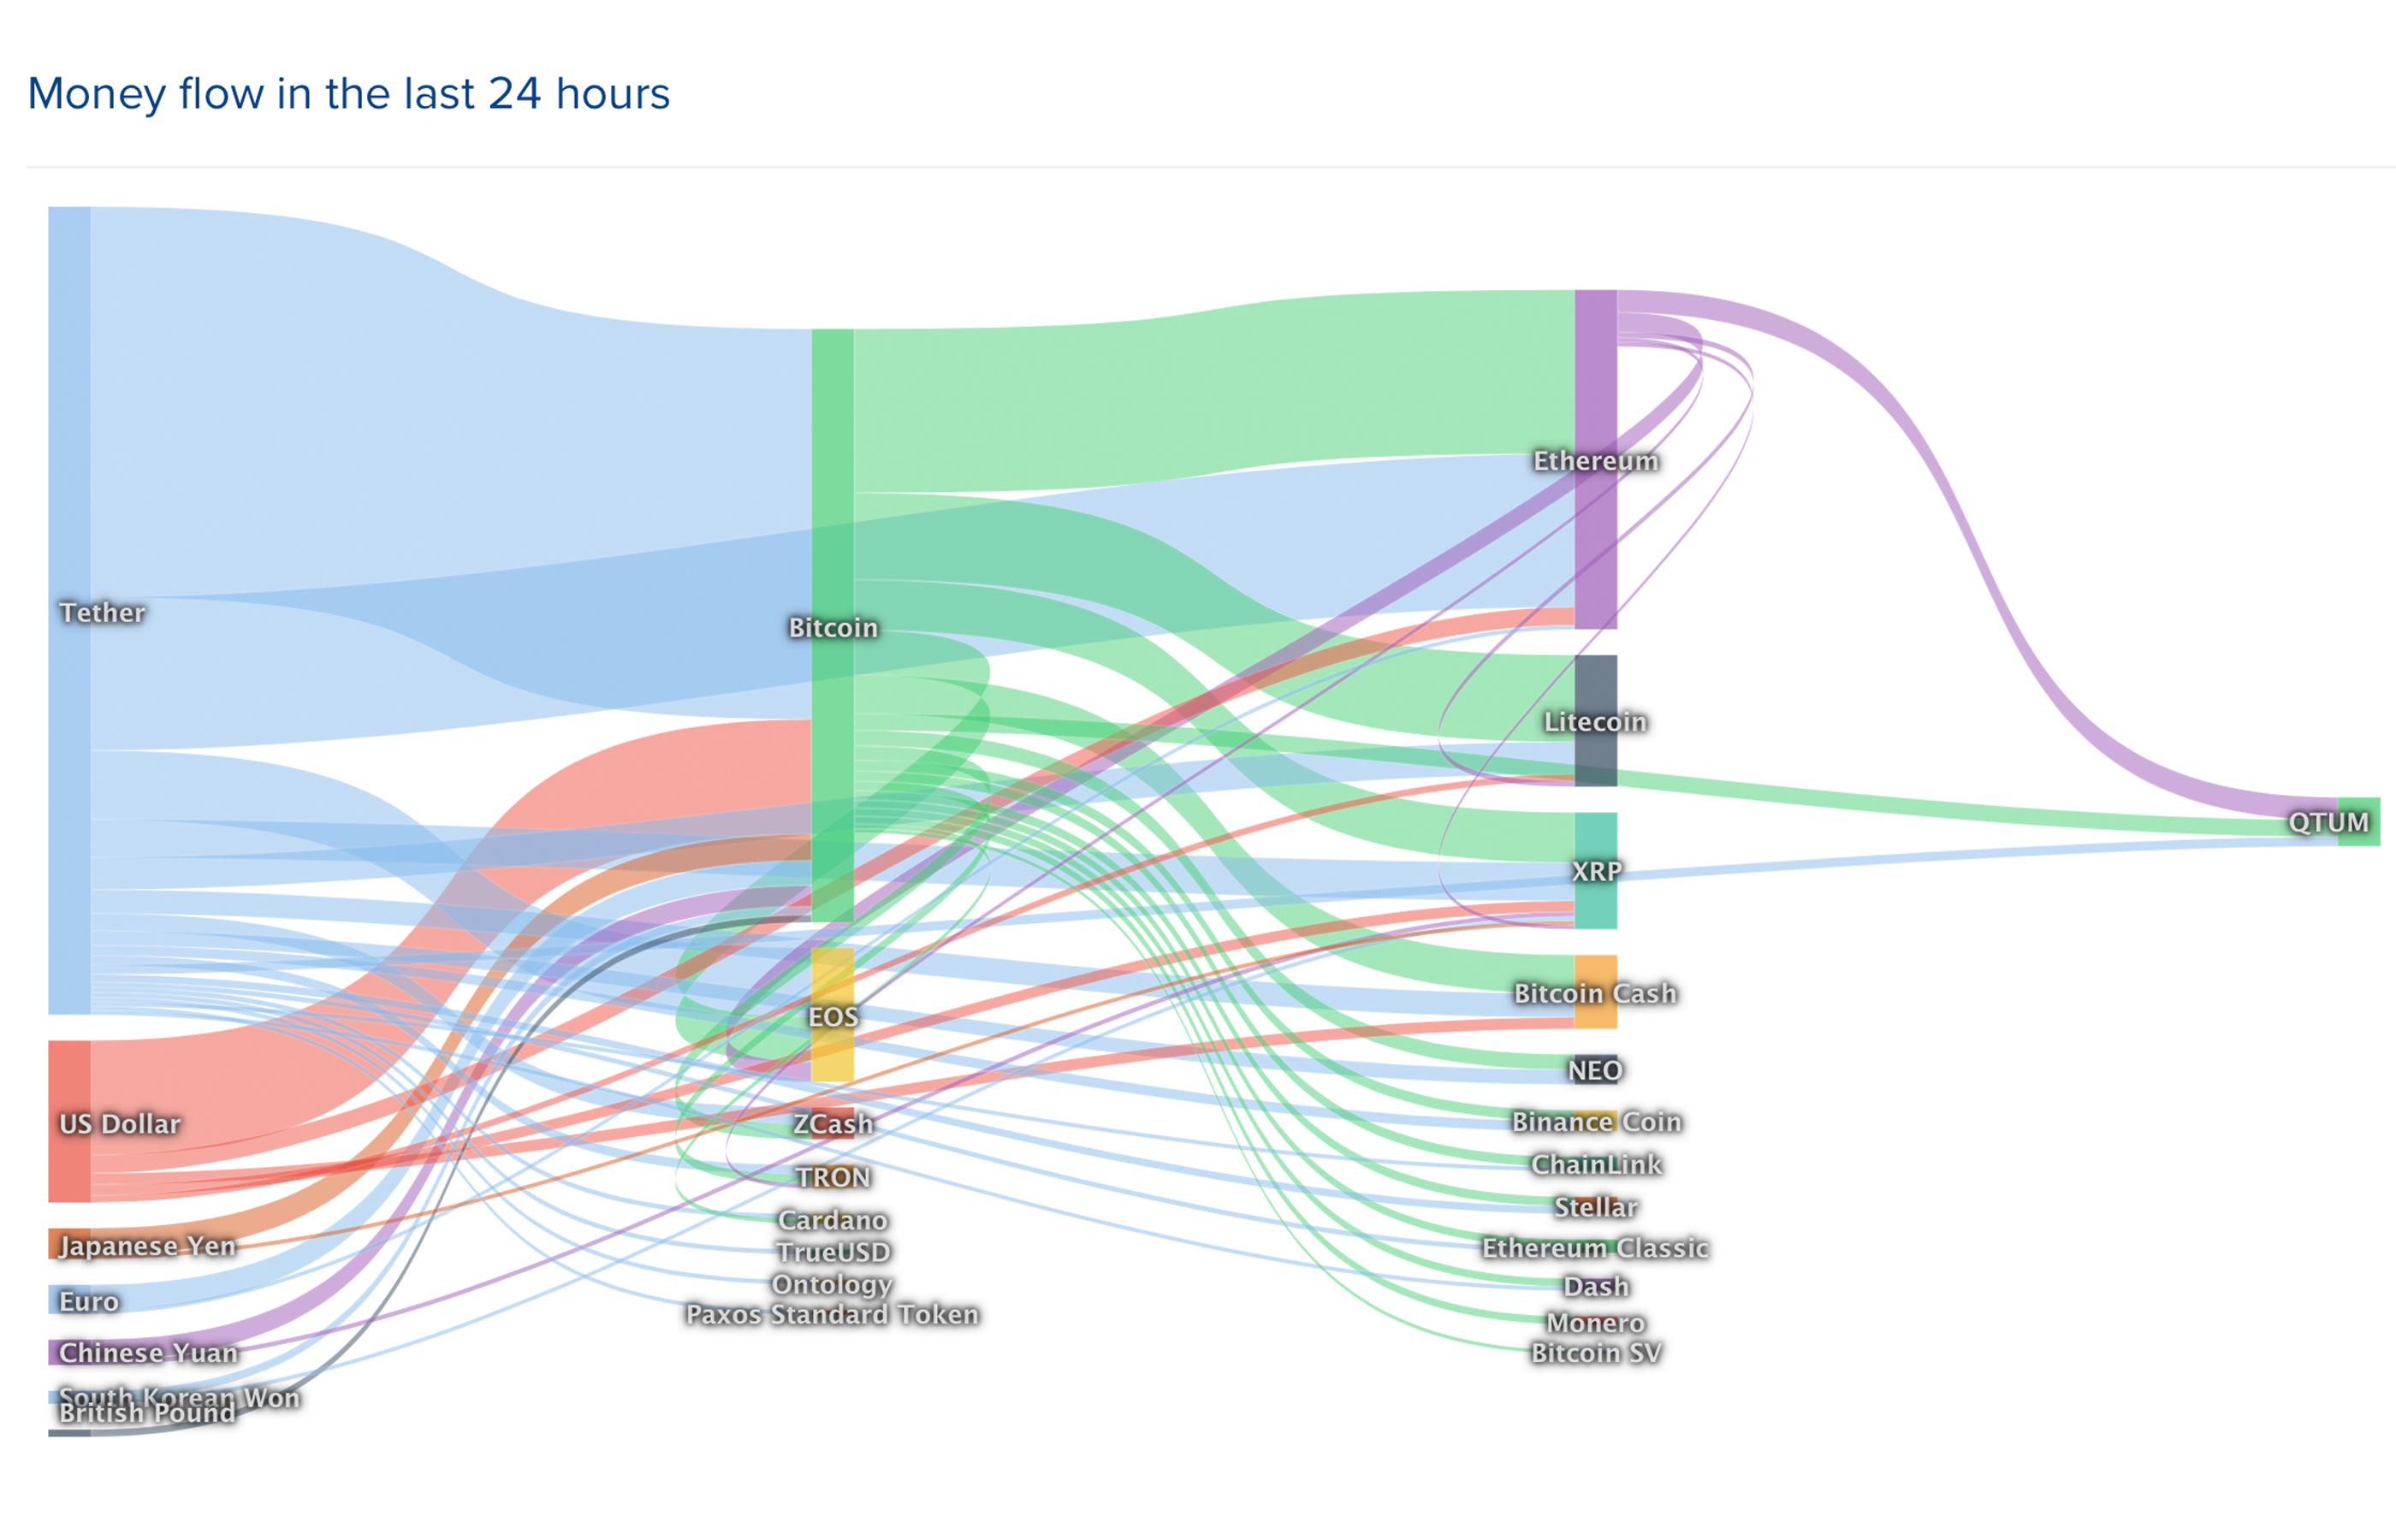
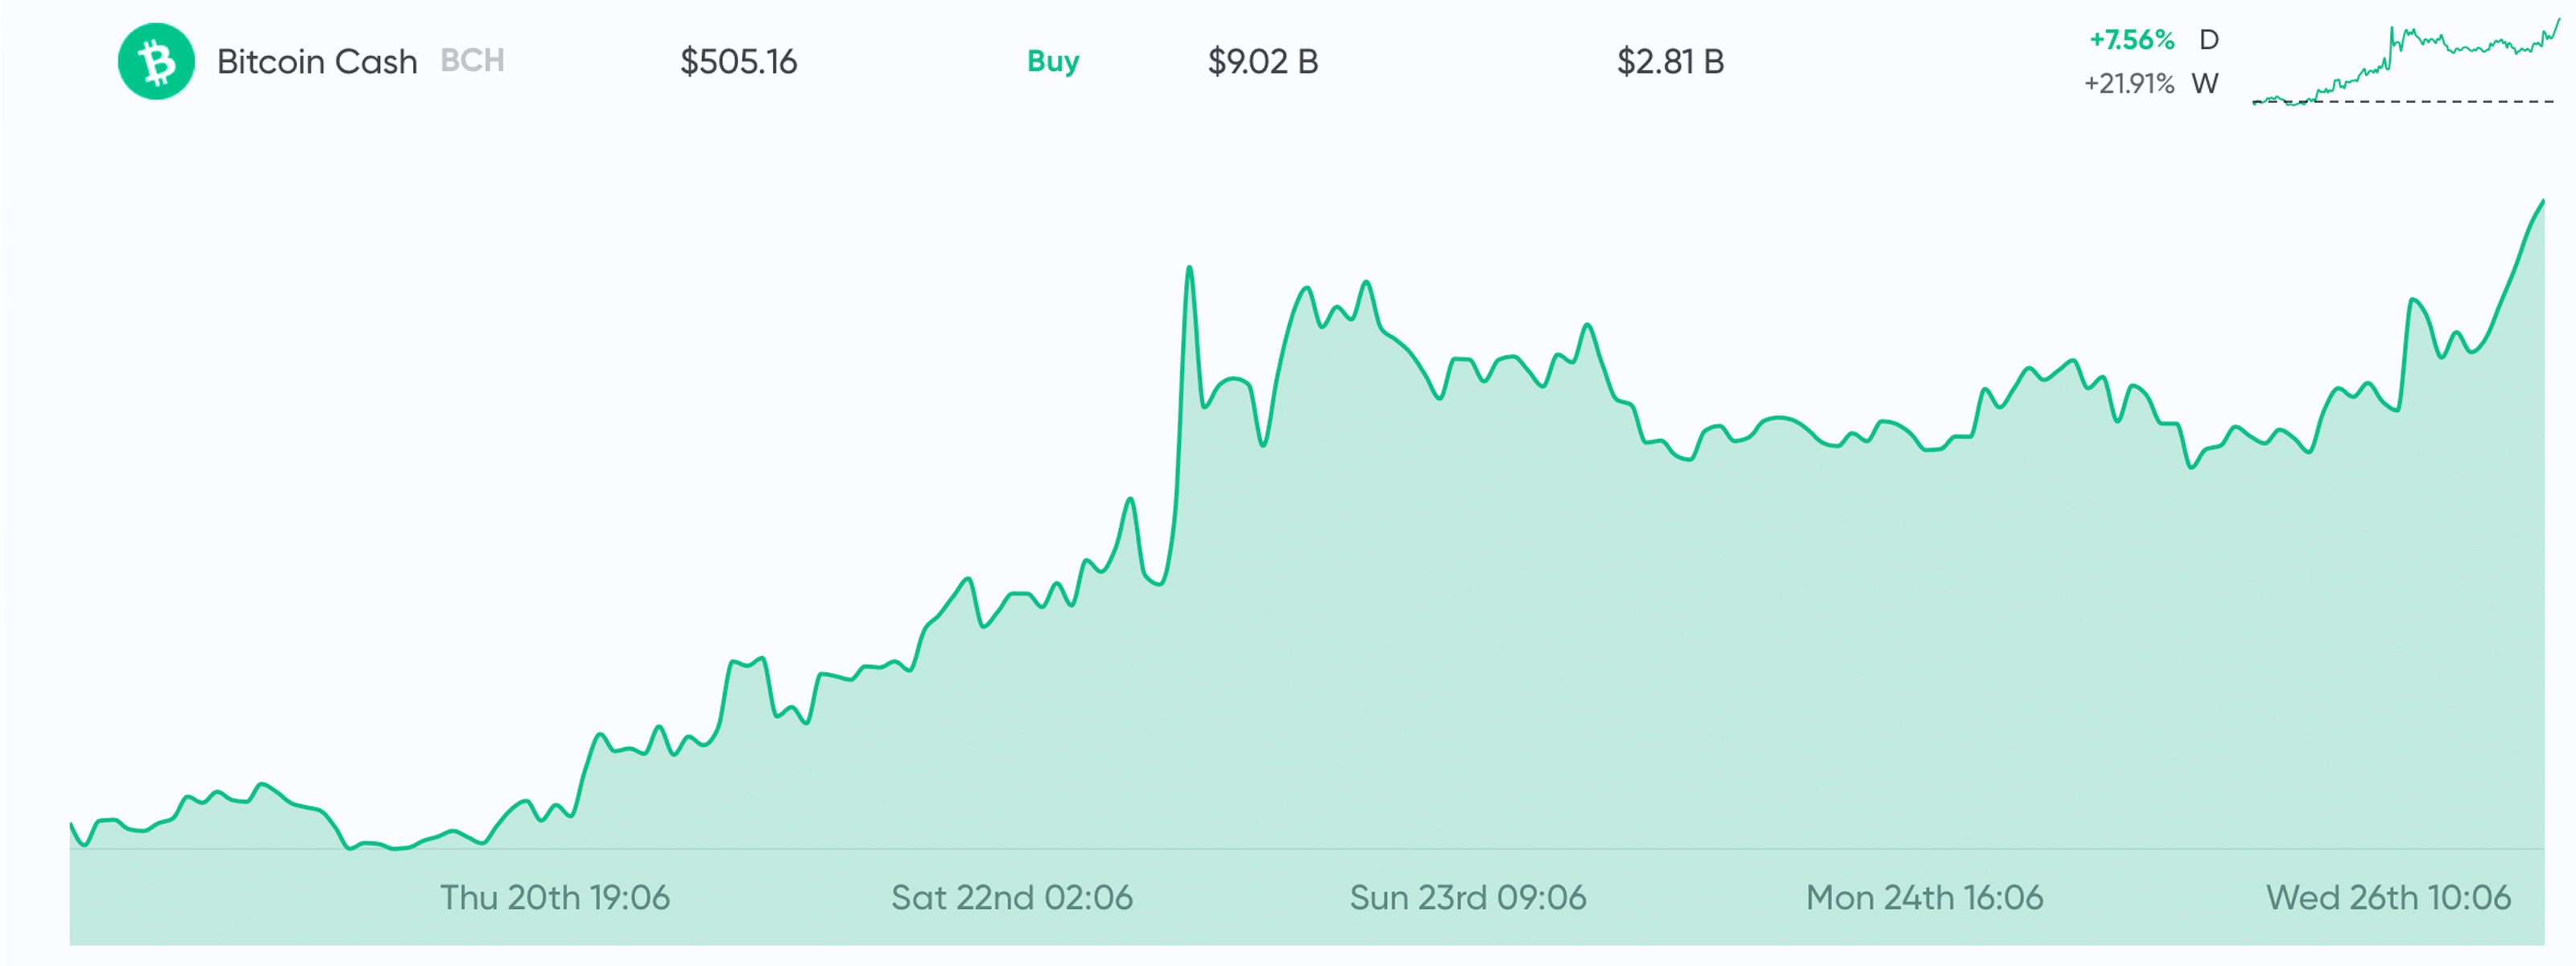
Bitcoin Cash has been on a roll this week as well in fourth position as markets have spiked 21%. One BCH is swapping for $505 and the market has a total valuation of around $9 billion today. BCH is also up more than 7.5% today with around $2.8 billion in global trades. The top exchanges trading the most BCH on June 26 include Coinbene, Binance, Bibox, Digifinex, and Huobi Pro. BCH is still the sixth most traded coin below EOS and above XRP. There are six dominant pairs with BCH this Wednesday with tether (USDT) capturing 44% of all BCH trades. This is followed by BTC (28%), USD (11%), KRW (7.8%), ETH (2.6%), JPY (2%), and EUR (1.4%). The KRW, JPY, and EUR pairs against BCH have increased considerably over the last few weeks.
BCH/USD Technical Indicators
Looking at the technical analysis gauges displayed real-time shows BCH bulls have been moving steadily, breaking upper resistance levels. Looking at the 4-hour chart for BCH/USD on Kraken shows most moving averages and oscillators are still fairly bullish. The Relative Strength Index (RSI), however, is showing overbought conditions with a value of ~72.30 at press time. Stochastic percentages (~87.50) are impartial at the moment which indicates some uncertainty exists among traders at these levels. Although, the two Simple Moving Averages (SMA) continue to indicate that the path toward the least resistance is still very much pointing toward the upside. MACd levels show things are still quite bullish suggesting room for more price improvements. Looking toward the upside, order books show strong resistance between the $530-560 zones and smoother seas up until $600. On the backside, if bears managed to exhaust the bulls then there will be pit stops between $485, 460, and $440 respectively.

Lots of Bull Run Driver Theories Circulating
Many coins have jumped to prices they once held over a year ago today but this was when the prices were in a downward spiral. Spectators are curious about what’s driving the current bull run and various theories abound. For one, many skeptics are looking at tether (USDT) for possibly moving the market. Since May there’s been more than $600 million in tether printed when BTC broke above the $8K range.
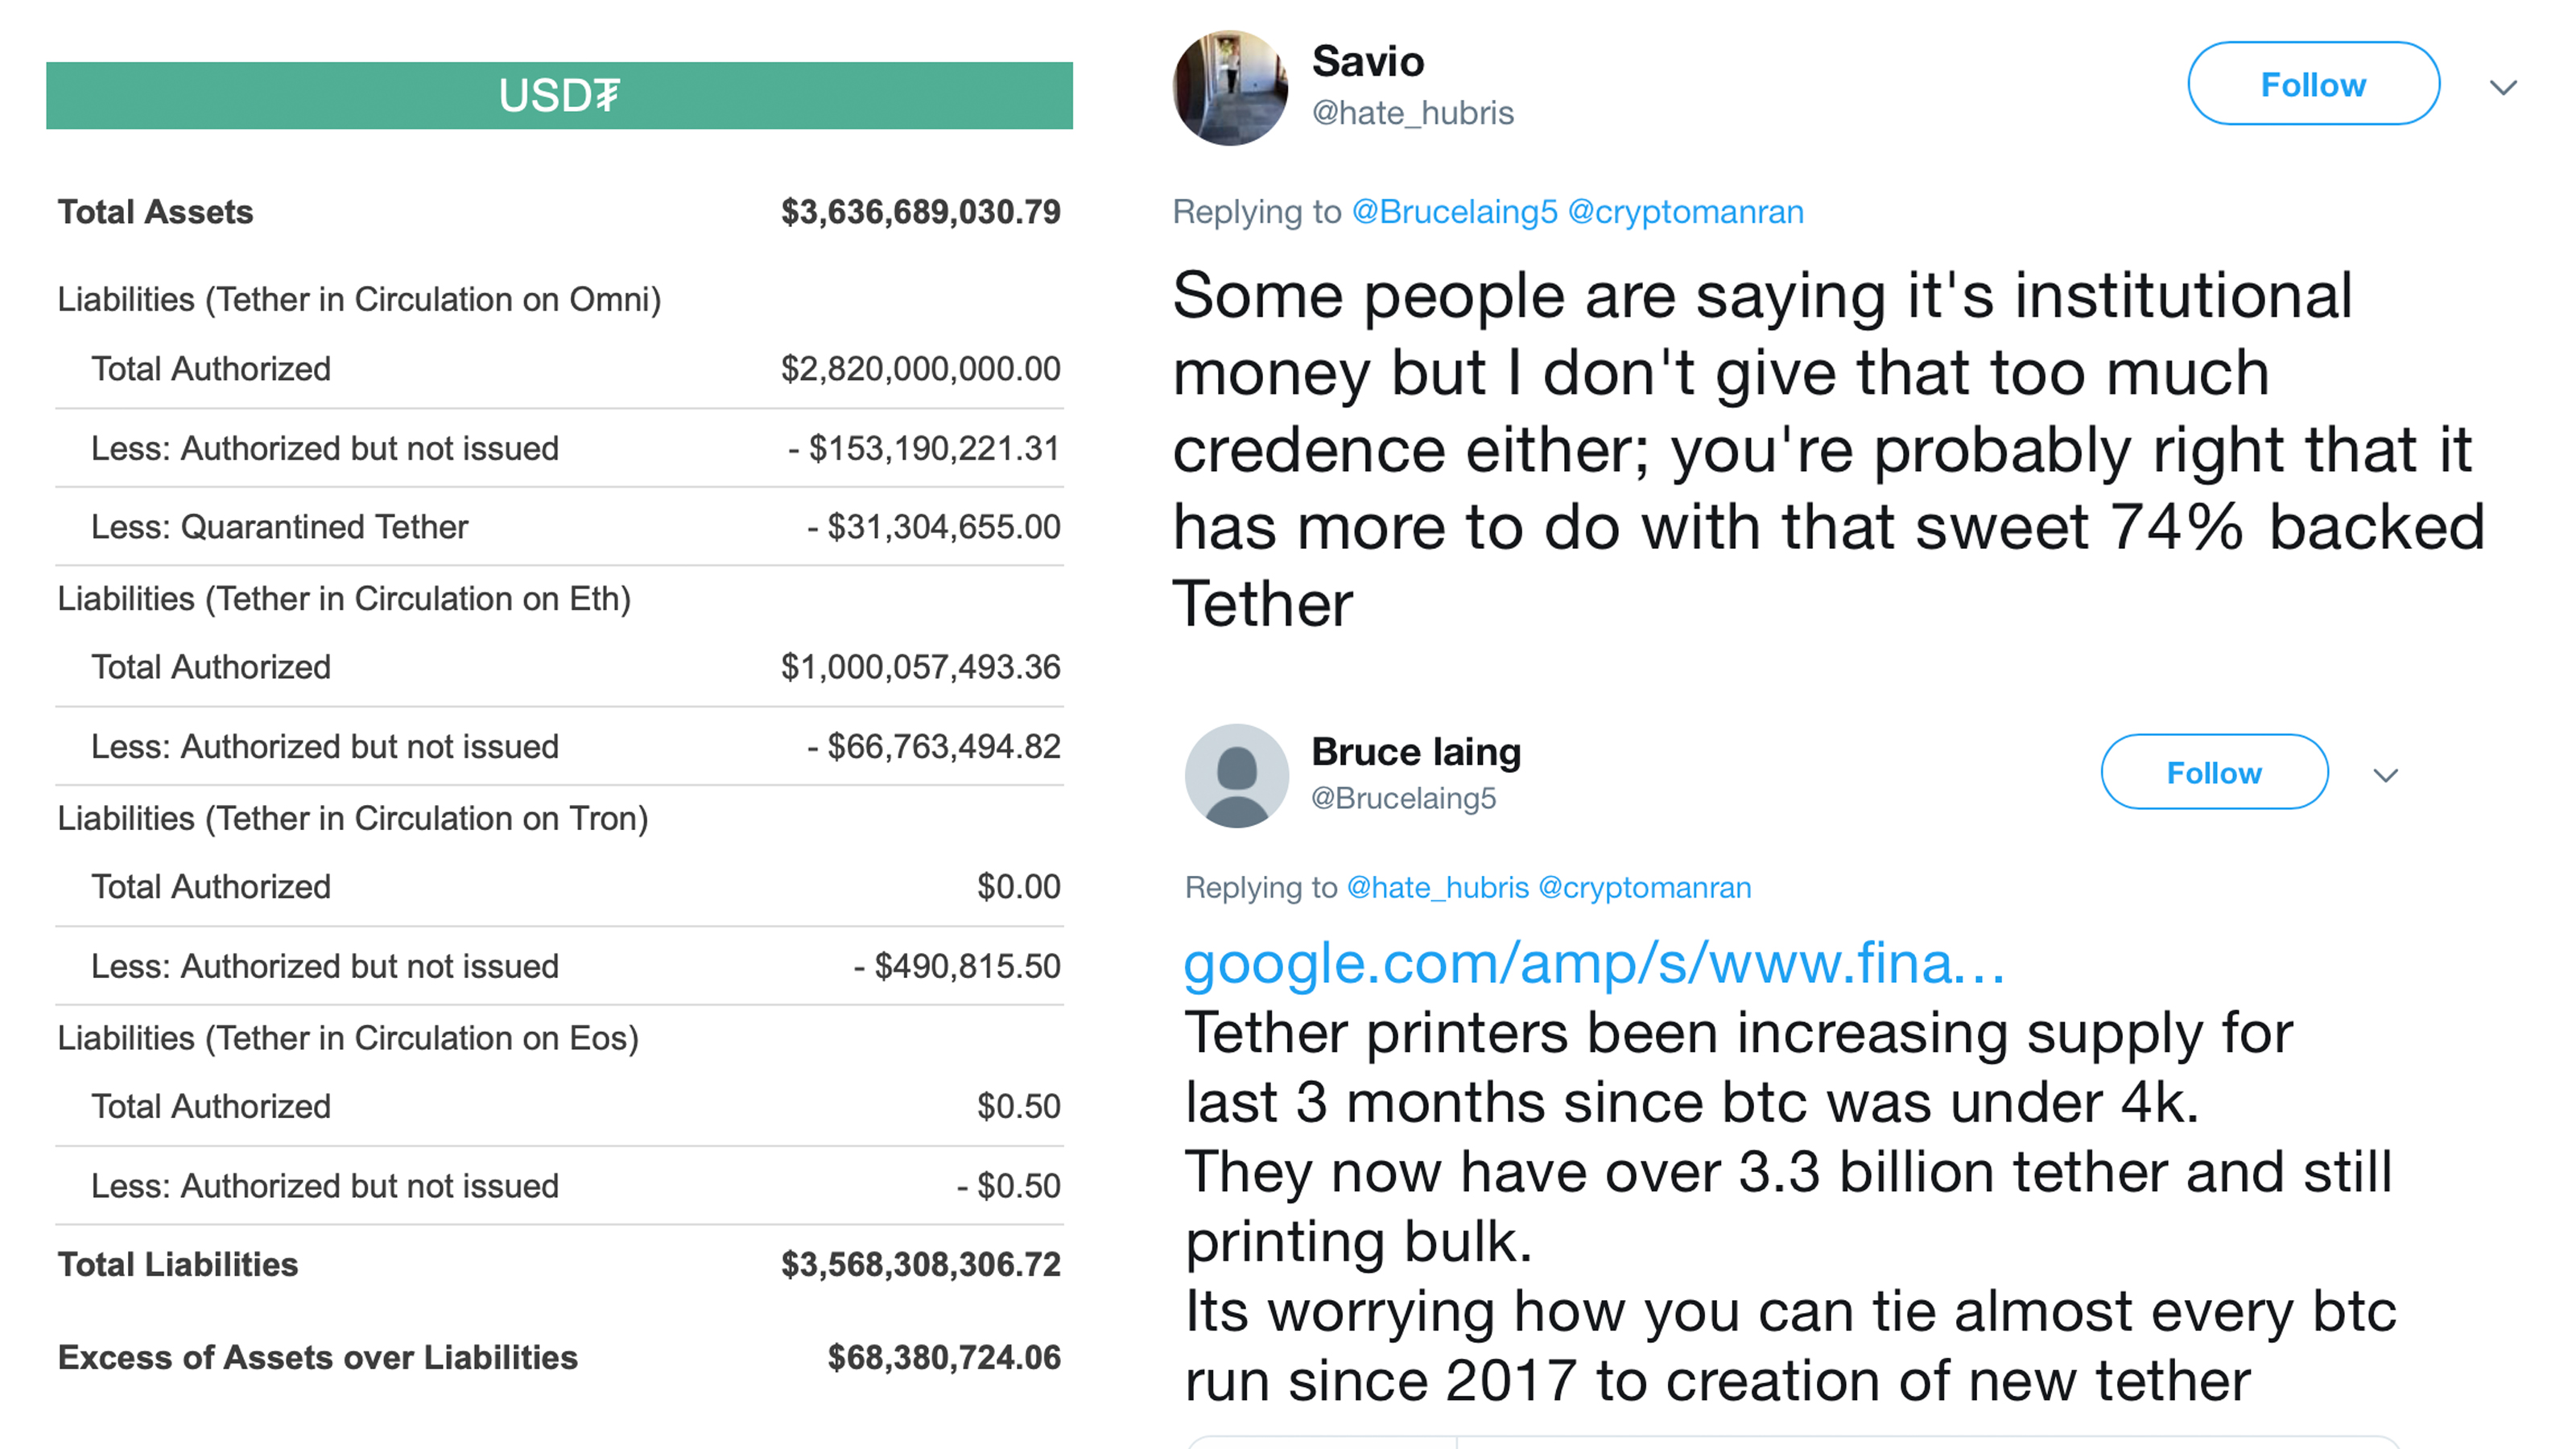
Because the bullish crypto prices have seemingly moved in tandem with the printing of fresh USDT, some believe these events are correlated. BTC whales have been moving very large sums to unknown wallets as well, and according to Whale Alert, more than $200 million worth of BTC was transferred in a few hours on June 25. Looking at when BCH and BTC whales accumulated massive amounts of coins back in February shows that mass accumulation has begun to slow. Rich list data stemming from BCH and BTC whales shows there wasn’t a lot of aggregation of wealth between this period.
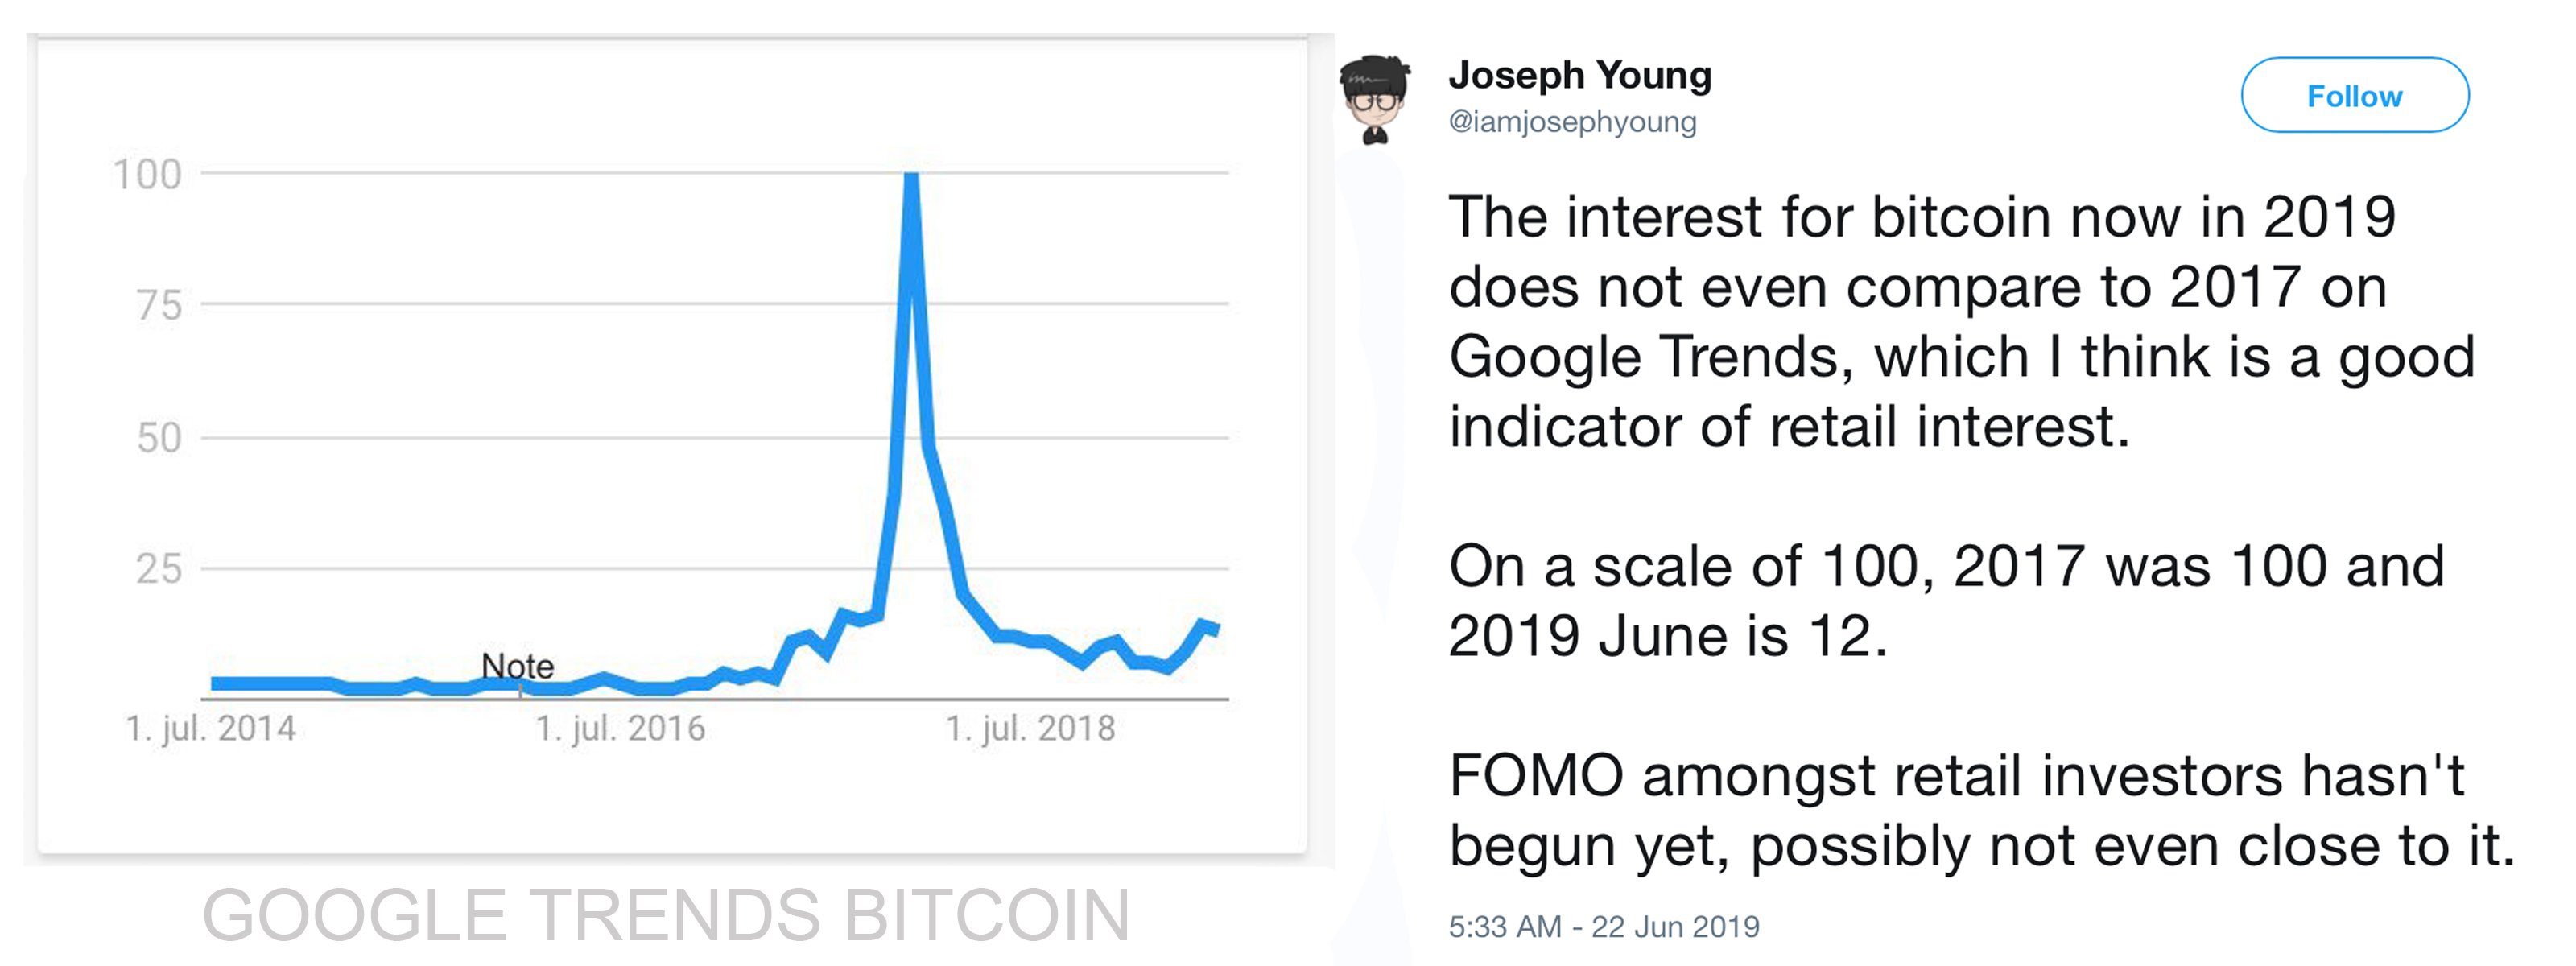
Other possible drivers of the crypto bull run include the world economy which seems to be on the brink of another long recession. Central banks around the world are discussing slashing interest rates and people speculate the U.S. Federal Reserve may do the same this July. An example of people moving money into safe haven assets because of the economic forecast shows gold touching an all-time high of $1,450 per ounce. Google trends when searching specific words like “buy bitcoin” and “bitcoin” are not nearly as high as they were in 2017. This indicates the mainstream may not be paying attention to the current spike as they did two years ago, but some speculators believe the ‘new money’ is stemming from institutional investors. It’s hard to say where the cryptoconomy will take us next but we can be pretty damn sure it’s going to be an interesting ride.
Where do you see the price of bitcoin cash and the rest of the crypto markets heading from here? Let us know what you think about this subject in the comments section below.
Disclaimer: Price articles and markets updates are intended for informational purposes only and should not to be considered as trading advice. Neither Bitcoin.com nor the author is responsible for any losses or gains, as the ultimate decision to conduct a trade is made by the reader. Always remember that only those in possession of the private keys are in control of the “money.”
Images via Shutterstock, Trading View, Bitcoin.com Markets, JP Morgan, and Coinlib.io.
Want to create your own secure cold storage paper wallet? Check our tools section. You can also enjoy the easiest way to buy Bitcoin online with us. Download your free Bitcoin wallet and head to our Purchase Bitcoin page where you can buy BCH and BTC securely.
The post Markets Update: Cryptocurrency Prices Continue to Accelerate appeared first on Bitcoin News.
by Jamie Redman via Bitcoin News
Comments
Post a Comment