- Ripple price started a downside correction after testing the $0.3100 resistance against the US dollar.
- The price traded below the $0.3080, $0.3065 and $0.3060 support levels.
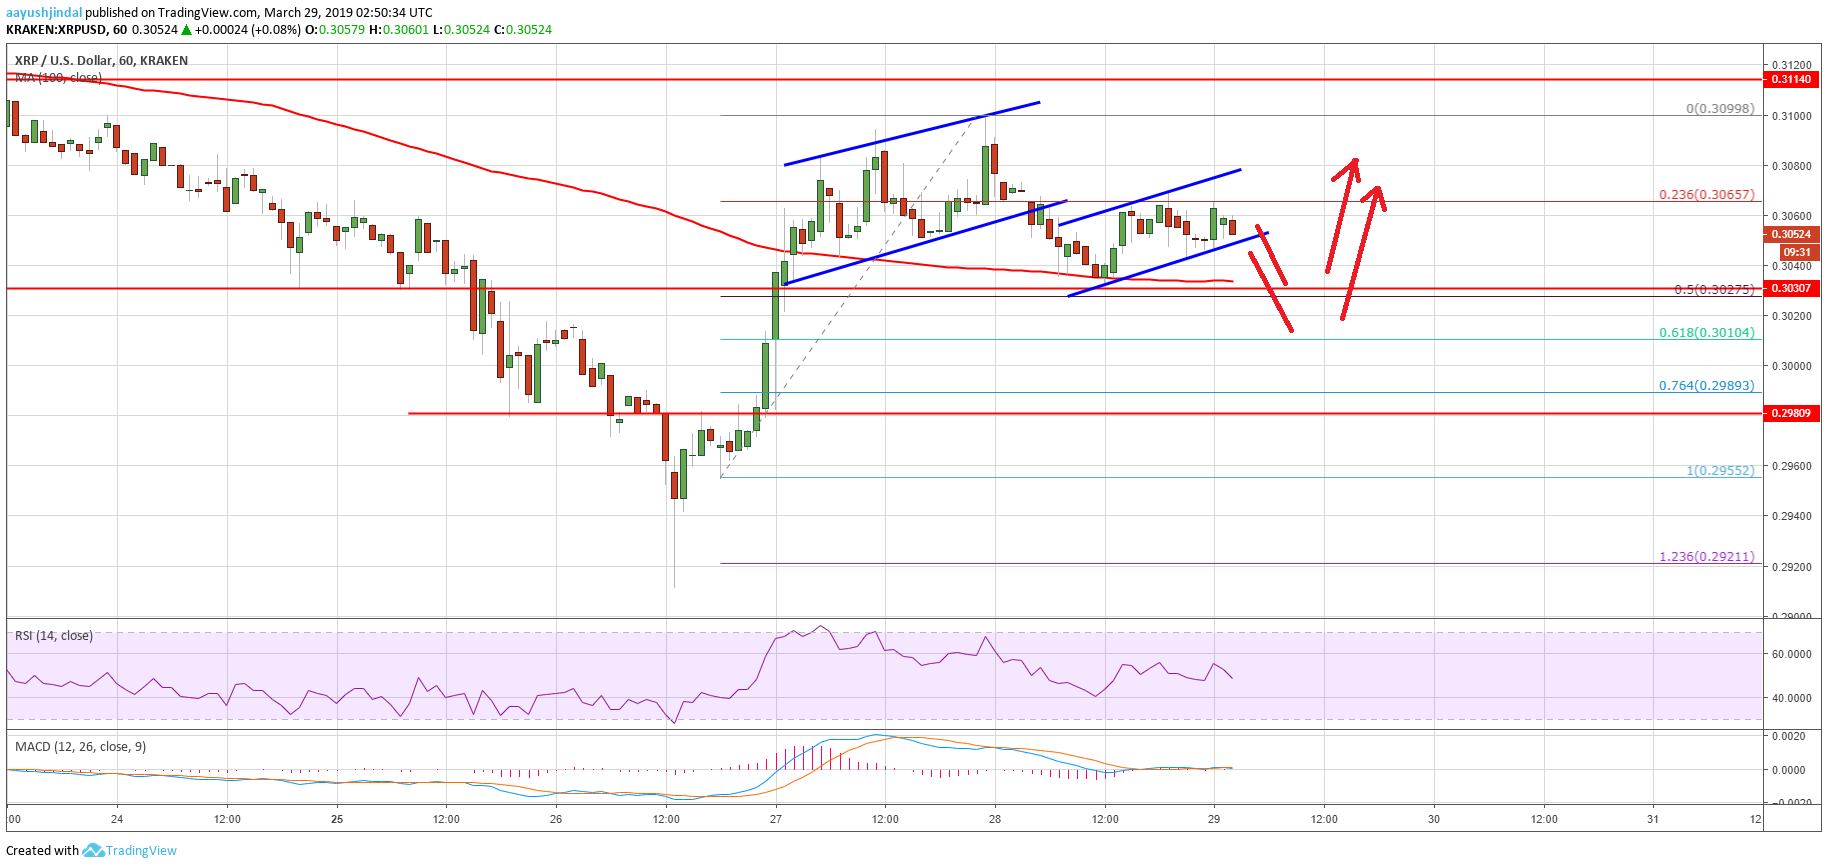
- A replica of the previous ascending channel is formed with support at $0.3050 on the hourly chart of the XRP/USD pair (data source from Kraken).
- The pair is likely to extend the correction towards the $0.3025 support before a fresh increase.
Ripple price corrected lower recently from important resistances against the US Dollar and bitcoin. XRP/USD is likely to find a strong buying interest on dips near $0.3025 and $0.3010.
Ripple Price Analysis
Recently, we saw a solid rebound in ripple price above the $0.3000 pivot level against the US Dollar. The XRP/USD pair even settled above the $0.3025 resistance and the 100 hourly simple moving average. There was an upside extension above the $0.3065 and $0.3080 levels. However, the price faced a strong selling interest near the $0.3100 level. A swing high was formed at $0.3099 and later the price started a downside correction.
It corrected below the $0.3080 support and the 23.6% Fib retracement level of the last leg from the $0.2955 low to $0.3100 swing high. Later, there was a break below a short term ascending channel $0.3065 on the hourly chart of the XRP/USD pair. Finally, there was a break towards the $0.3025 support and the 100 hourly SMA. The price traded close to the 50% Fib retracement level of the last leg from the $0.2955 low to $0.3100 swing high. At the outset, the price is rebounding and trading above the $0.3040 level.
More importantly, a replica of the previous ascending channel is formed with support at $0.3050 on the same chart. Therefore, there are chances of another dip towards the $0.3025 support and the 100 hourly SMA. If there are more losses, the next support is near the $0.3010 level. It represents the 61.8% Fib retracement level of the last leg from the $0.2955 low to $0.3100 swing high.

Looking at the chart, ripple price might dip in the short term, but it remains supported near the $0.3025 and $0.3010 levels. The next main support is at $0.3000, below which the price may move back in a bearish zone. On the upside, an initial resistance is near the $0.3080 level. An upside extension could lead the price towards the $0.3100 resistance. Finally, a break above $0.3100 is likely to push the price towards $0.3200.
Technical Indicators
Hourly MACD – The MACD for XRP/USD is currently flat in the bullish zone.
Hourly RSI (Relative Strength Index) – The RSI for XRP/USD is currently moving lower towards the 50 level.
Major Support Levels – $0.3050, $0.3025 and $0.3010.
Major Resistance Levels – $0.3080, $0.3095 and $0.3100.
The post Ripple (XRP) Price Analysis: Fresh Increase or Further Decline? appeared first on NewsBTC.
by Aayush Jindal on March 29, 2019 at 10:30AM
Comments
Post a Comment