- Bitcoin price is slowly recovering and it is currently trading above the $3,750 support against the US Dollar.
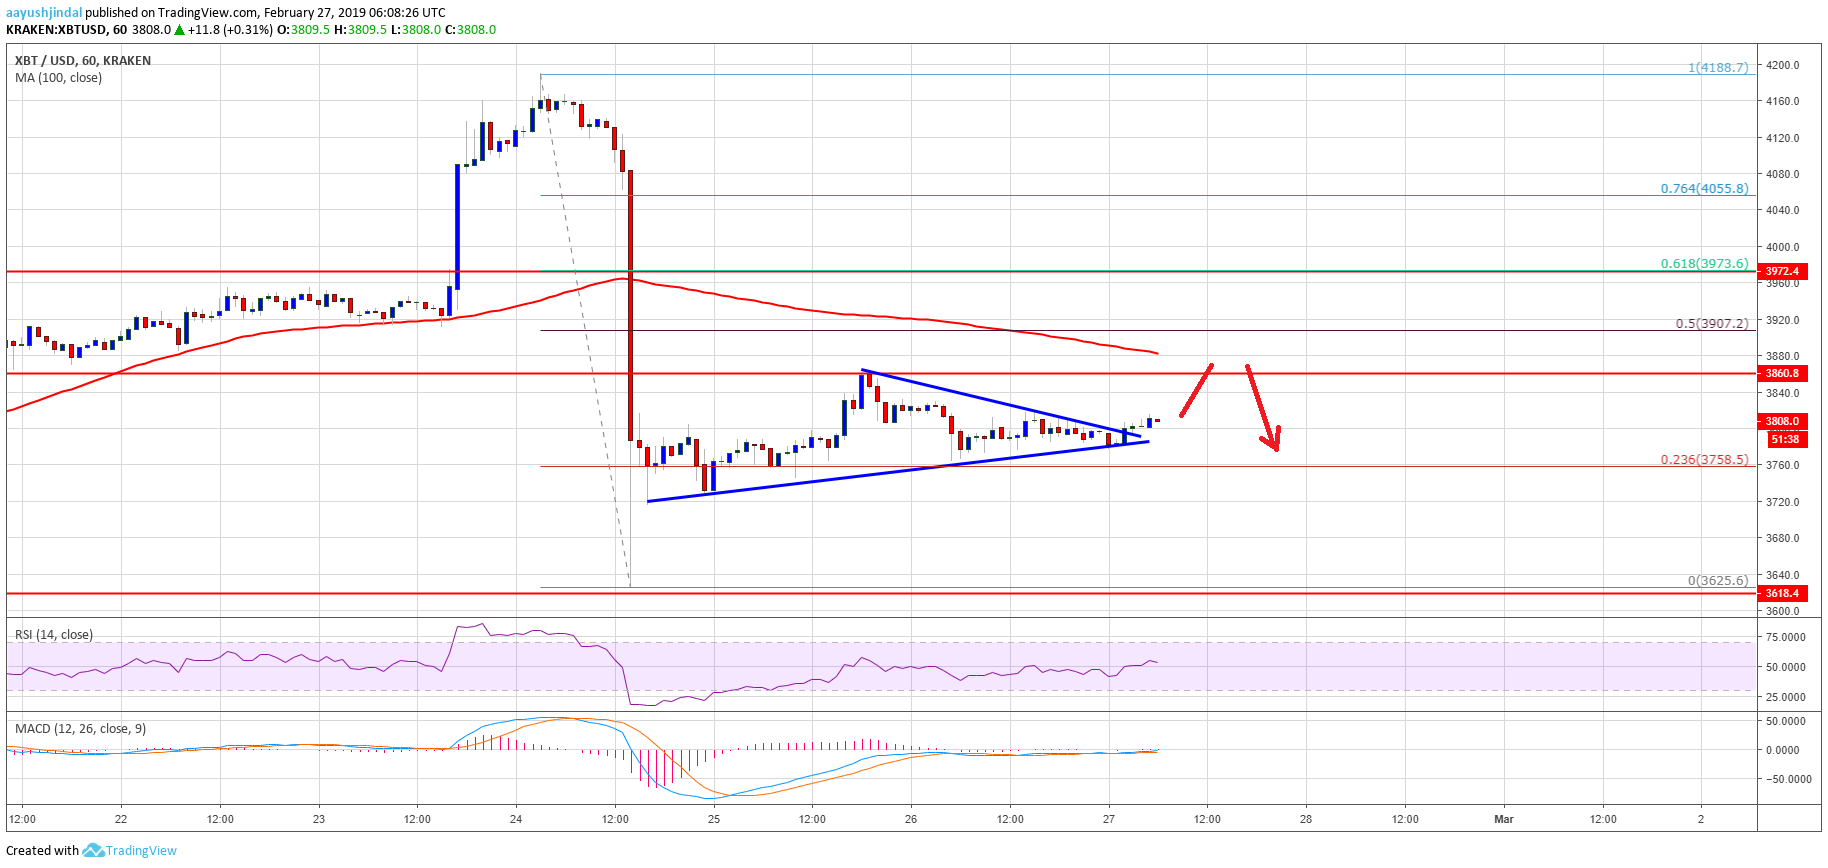
- There was a break above a short term contracting triangle with resistance at $3,795 on the hourly chart of the BTC/USD pair (data feed from Kraken).
- The pair is likely to struggle near the $3,860 resistance and the 100 hourly simple moving average.
- Buyers could gain traction only if there is a close above $3,900 and the 100 hourly SMA in the near term.
Bitcoin price formed a decent support and recovered above $3,780 against the US Dollar. However, BTC remain a sell as long as it is trading below the key $3,860 and $3,900 resistance levels.
Bitcoin Price Analysis
After a major decline below the $4,000 support, bitcoin price found support near $3,625 against the US Dollar. The BTC/USD pair started an upside correction and traded above the $3,700 and $3,750 resistance levels. There was a push above the 23.6% Fib retracement level of the last downside move from the $4,188 high to $3,625 low. It opened the doors for a larger recovery above the $3,800 level. However, the price struggled to break the key $3,860 resistance and later the price started consolidating gains.
To the downside, the $3,750 level acted as a decent support. The price formed a support base and later moved above $3,780. Recently, there was a break above a short term contracting triangle with resistance at $3,795 on the hourly chart of the BTC/USD pair. The pair is slowly moving higher and it seems like it could retest the key $3,860 resistance level. However, the main resistance is near the $3,880 level and the 100 hourly simple moving average. Above the 100 hourly SMA, the price could test the $3,900 pivot level.
Finally, the 50% Fib retracement level of the last downside move from the $4,188 high to $3,625 low is just above $3,900. Therefore, it seems like there are many resistances formed near the $3,860, $3,880 and $3,900 levels. To start a decent upward move, a close above the $3,880 level and the 100 hourly SMA is very important.

Looking at the chart, bitcoin price may perhaps continue to struggle as long as it is below $3,900. On the downside, the main support is at $3,750, below which there is a risk of more losses. The next key support is at $3,720 and $3,700.
Technical indicators
Hourly MACD – The MACD is currently flat in the bearish zone.
Hourly RSI (Relative Strength Index) – The RSI for BTC/USD managed to move above the 50 level, with a few positive signs.
Major Support Level – $3,750 followed by $3,720.
Major Resistance Level – $3,860, $3,880 and 3,900.
The post Bitcoin Price Watch: BTC Remains Sell Until It Breaks 100 SMA appeared first on NewsBTC.
by Aayush Jindal on February 27, 2019 at 12:00PM
Comments
Post a Comment