- ETH price stayed below the $107 resistance level, with bearish signs against the US Dollar.
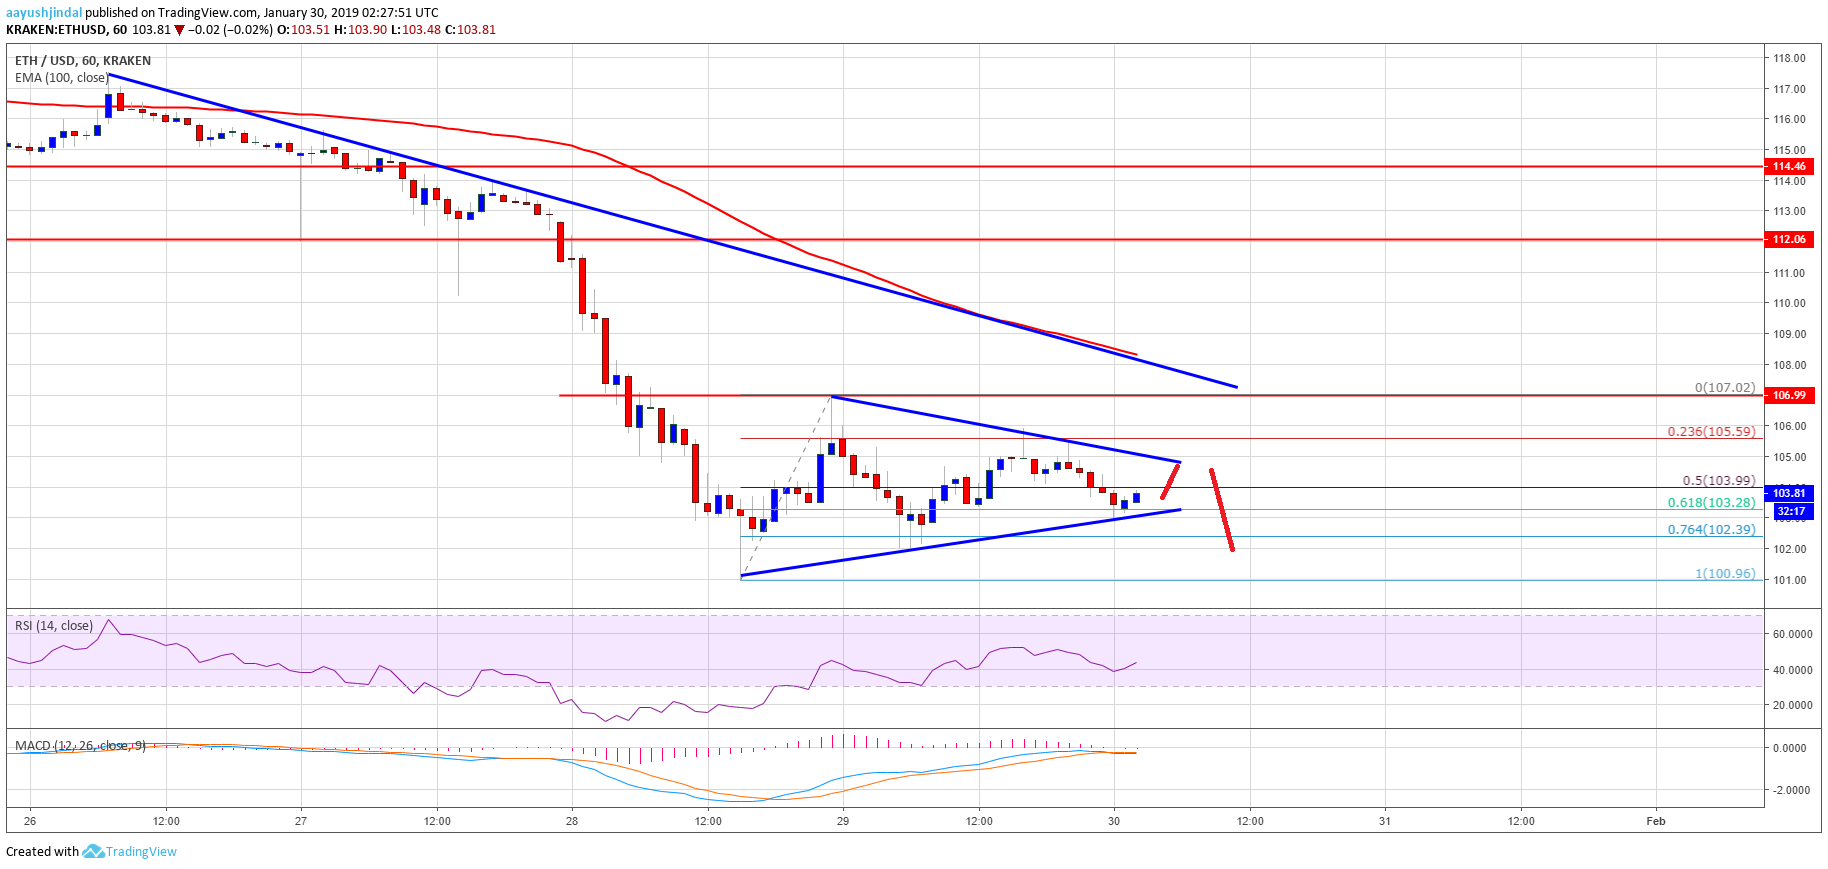
- There is a major bearish pennant formed with resistance near $106 on the hourly chart of ETH/USD (data feed via Kraken).
- The pair could accelerate losses below the $100 level if there is a bearish break below $103.
Ethereum price is forming a bearish continuation pattern against the US Dollar and bitcoin. ETH/USD remains at a risk of more losses as long as it is trading below $107.
Ethereum Price Analysis
Yesterday, we saw a tiny recovery above the $104 level in ETH price against the US Dollar. The ETH/USD pair even traded above the 23.6% Fib retracement level of the last decline from the $114 high to $101 swing low. However, the price failed to break the $107 resistance level. As a result, there was a fresh drop below the $106 level. The price moved below the 50% Fib retracement level of the recent wave from the $101 swing low to $107 high. However, the decline was protected by the $103 level.
More importantly, there is a major bearish pennant formed with resistance near $106 on the hourly chart of ETH/USD. The triangle resistance could play a major role near $106-107. If there is a break above $107, the price may trade towards the $110 and $112 levels. On the other hand, if there is a downside break below $103, the price is likely to accelerate losses in the near term. It seems like the 61.8% Fib retracement level of the recent wave from the $101 swing low to $107 high is currently protecting losses. However, it may soon give up if there is no break above $106 and $107.

Looking at the chart, ETH price is clearly under a lot of pressure below $107. If there is an increase in selling, the price is likely to decline below $103 and $101.
ETH Technical Indicators
Hourly MACD – The MACD for ETH/USD is about to move back in the bearish zone.
Hourly RSI – The RSI for ETH/USD is currently above the 40 level, with a minor bullish angle.
Major Support Level – $101
Major Resistance Level – $107
The post Ethereum Price Analysis: ETH Forming Bearish Continuation Pattern appeared first on NewsBTC.
by Aayush Jindal on January 30, 2019 at 09:38AM
Comments
Post a Comment