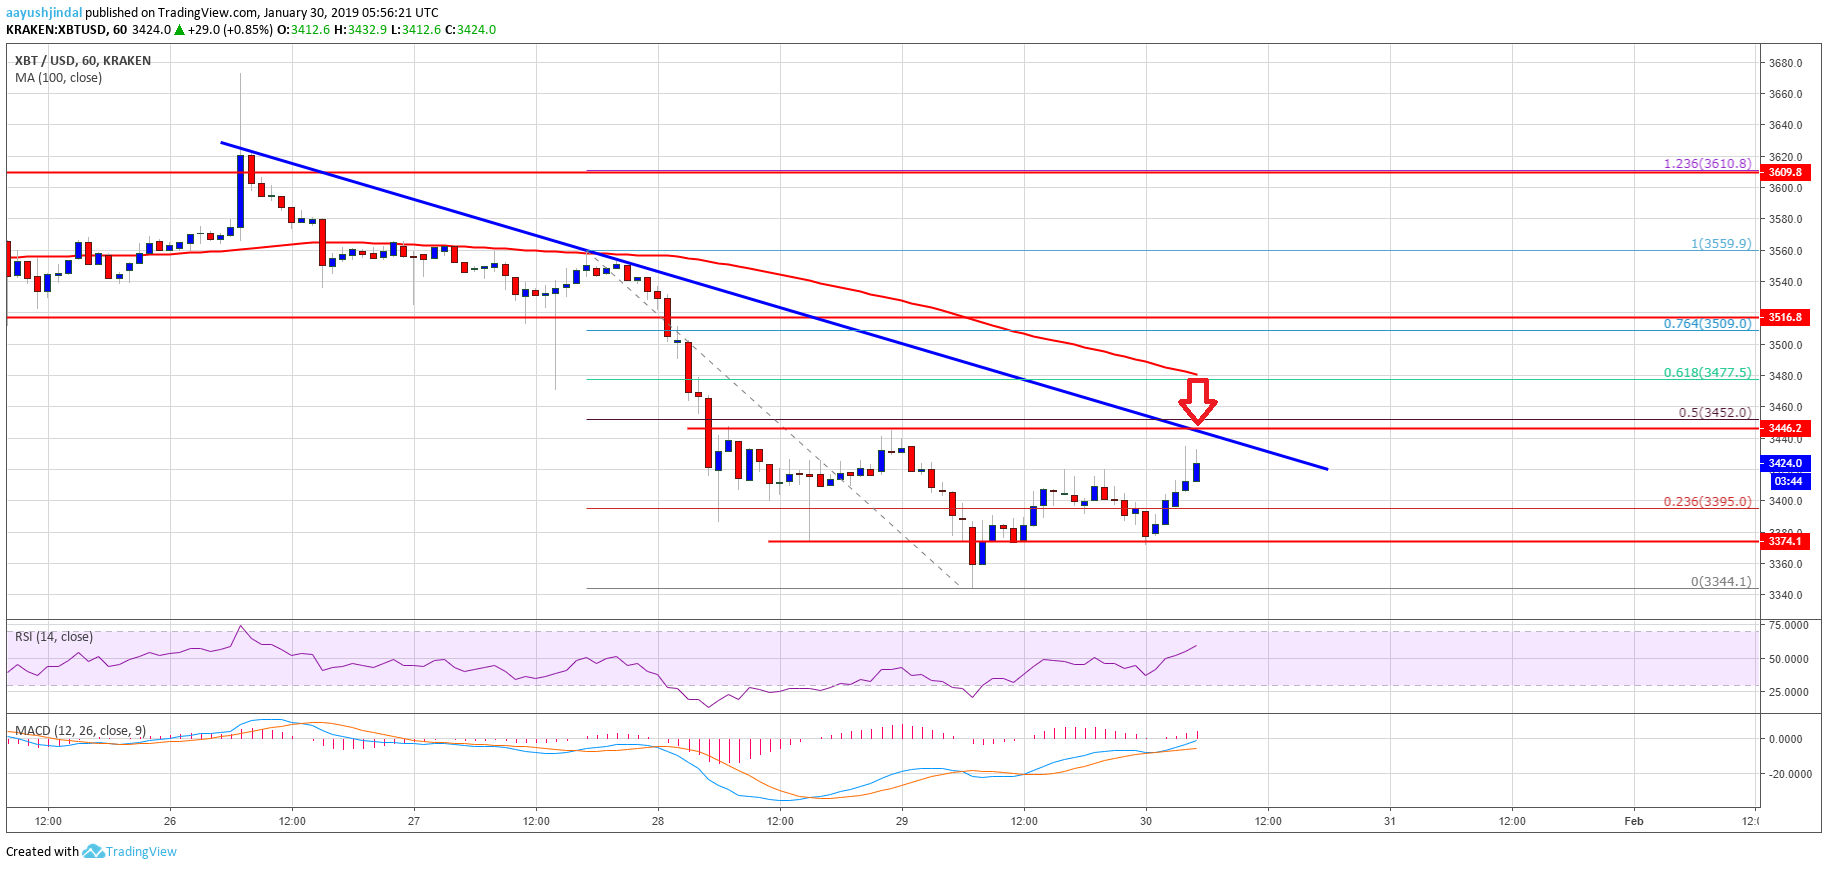
- Bitcoin price traded to a new monthly low towards $3,340 and later recovered against the US Dollar.
- Yesterday’s highlighted key bearish trend line is intact with resistance at $3,450 on the hourly chart of the BTC/USD pair (data feed from Kraken).
- The price may start a short term rebound if there is a proper break above $3,450 and $3,480.
Bitcoin price dipped to a new yearly low and later recovered against the US Dollar. BTC could decline once again if it fails to break the $3,450-3,480 resistance area in the short term.
Bitcoin Price Analysis
Yesterday, we saw a major decline in bitcoin price below the $3,400 support against the US Dollar. The BTC/USD pair traded below the $3,360 support and formed a new yearly low at $3,344. Later, there was a fresh upside correction above the $3,380 and $3,400 levels. The price moved above the 23.6% Fib retracement level of the last drop from the $3,560 swing high to $3,344 low. Buyers were able to push the price above the $3,420 level, but there is a strong resistance formed near the $3,450 level.
Besides, yesterday’s highlighted key bearish trend line is intact with resistance at $3,450 on the hourly chart of the BTC/USD pair. The trend line resistance coincides with the 50% Fib retracement level of the last drop from the $3,560 swing high to $3,344 low. Therefore, a proper break above the trend line and $3,452 is must for further gains. The next major resistance is near the $3,500 level. An intermediate resistance is $3,480 and the 100 hourly simple moving average. On the other hand, if buyers fail to gain strength above $3,450 and $3,480, there could be a fresh bearish wave.

Looking at the chart, bitcoin price is approaching the key $3,450 resistance. On the downside, an initial support is at $3,375, below which the price may revisit the $3,340 level, followed by $3,300.
Technical indicators
Hourly MACD – The MACD for BTC/USD is slowly gaining momentum in the bullish zone.
Hourly RSI (Relative Strength Index) – The RSI for BTC/USD is now placed above the 50 level.
Major Support Level – $3,340
Major Resistance Level – $3,450
The post Bitcoin Price Watch: BTC Rally Remains Attractive To Sellers appeared first on NewsBTC.
by Aayush Jindal on January 30, 2019 at 12:15PM
Comments
Post a Comment